
Tracking X (formerly Twitter) engagement rates tells you the story of what your audience wants.
Knowing these metrics lets you choose what topics and content you should keep posting to grow your niche – if you know what metrics to look for.
Say you’re tracking profile clicks for your posts to measure which kinds of content increases your followers. But profile-clicks can also mean people didn’t like that tweet, and they clicked your profile to unfollow you.
Luckily, there are Ai-driven engagement dashboards that give you data that goes deeper and puts more context around your tweets so you can adjust your content in ways that grow your following on X.
How to Track X Growth
Tracking X growth has always been free with X Analytics, which briefs you on simple metrics like your best post, best content post, and best mention of the month.
You used to be able to reach X Analytics from your profile picture. But X has been focusing on other updates to their platform, like X Spaces for social audio and Blue for premium services.
In 2020, X removed the Audience Insights tab from X Analytics altogether.
You can still use some of their features like tracking impressions and engagement rates, but other metrics are charted without showing you which post they belong to – which takes time and confuses your insights.
Here’s how to get better X analytics:
- Use analytics software that gives you insights charted clearly to see where your content is succeeding with your audience and what needs improvement.
- Track your past top-performing posts to gain insight over time to write better messages using what worked.
- Don’t worry about tracking posting times when you post automatically when your audience is online every time!
- Learn what stories different metrics tell you about your audience’s thoughts about your posts.
What is a good engagement rate on X?
A good engagement rate on X is 0.2 – 0.9%, and anything above 1% is considered great engagement. It’s essential to know because engagements = growth.
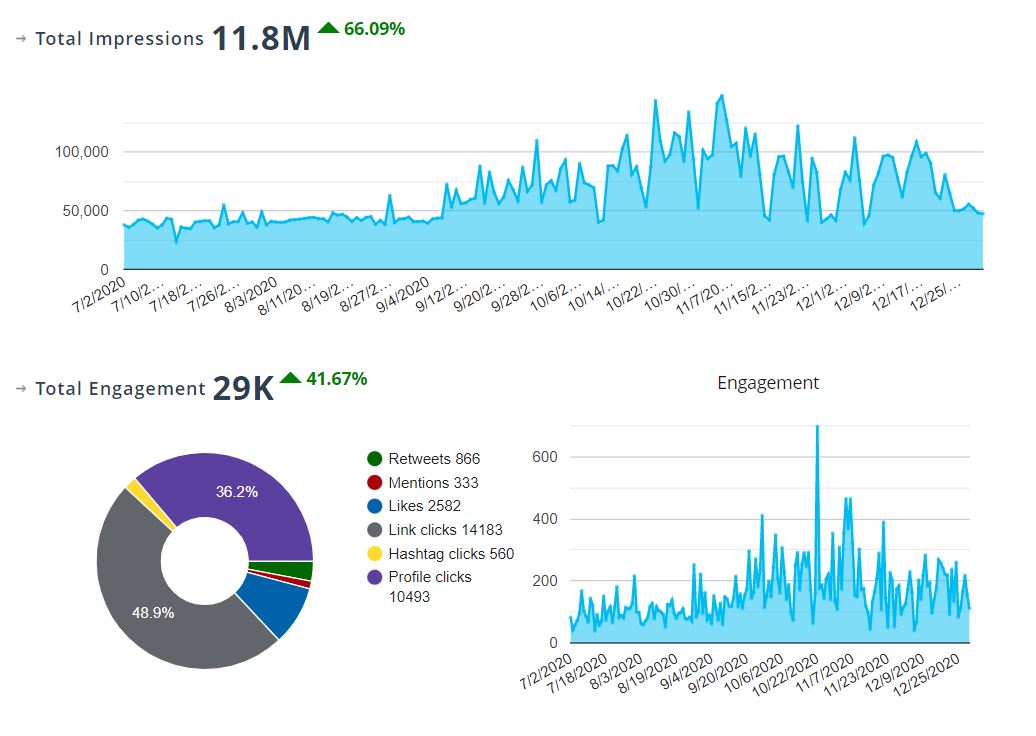
The engagement rate is calculated as a percentage of engagements on each post related to how many impressions it got.
In math form, that’s Engagement Rate (%) = Amount of Engagements / Amount of Followers x 100
Now you know what the engagement rate is, here’s what you can track to improve your engagements and grow your X community.
Here’s how to improve your engagement rate:
Improving your engagement rate is easy when you know what story each metric tells you about your audience.
Here are some examples of what metrics can tell you about what’s going through your community’s minds:
Impressions: How many people have stopped to read your post, or if it caught people’s attention.
Engagements: How many people chose to react to your tweet through:
- Link clicks
- Hashtag clicks
- Clicking your X profile photo or username
- Retweets
- Replies
- Follows
- Likes
Link Clicks: More people click on your links the more you write persuasively with great calls to action.
When people click links, it’s usually because you’re creating curiosity and offering something they want or need. This is why writing good headlines is critical when posting blog links to social media.
Hashtag Clicks: People are curious about what other posts are related to that topic. Many hashtag clicks could mean your audience is interested in other posts in that hashtag. So, give them more where that came from!
Don’t write too many hashtags that lead people away from your content, though. It’s widely known that using more than two hashtags lowers your engagement rate by 17%.
Try categorizing your content with unique hashtags no one else uses so your followers can click on them to access similar posts and increase impressions. For example, check out #30daysofbiz.
Profile Clicks: If people like your content, they’ll check your profile to see if you’re worth following from your other posts.
But profile clicks can also mean your post offended them or wasn’t relevant, so they clicked to unfollow you. That’s not a problem, though, because you can track your unfollows easily.
Retweets: People thought your content could be helpful or entertaining for their audience, which means continue to make content like this, so other people’s communities see your content and follow you.
Replies: Posts with lots of replies makes X show you to more people. So ask more questions or encourage people to reply below if they would like something you offer, like giveaways or advice.
Example: “Leave a ? below if you would like my X growth checklist sent to your DMs!”
Follows: If you received a lot of followers when you posted or engaged with others, continue to replicate that as well. Just look at your follower growth rate and filter your engagement metrics to that time period!
X chats are an old way to engage with others who actively use X. People still hold chats, and if you show up, you can attract real connections that make your community alive.
Likes: This one is obvious! Try to be as helpful as possible to get more of these.
The engagement metrics above tell you what goes through your followers’ minds so you can act accordingly depending on your growth goals. But if you can’t attribute them to your posts, how do you know what messages made your followers take action?
We recognize this essential aspect of community growth which is why our engagement data is customizable, straightforward, and works with you, not against you.
No matter how long in the past you wish to analyze, we’ve got the metrics. Show all of your top posts that are sortable by any metric you need to grow. You can even sort by content type if you schedule your posts in your content calendar with different posting schedules through pipelines.

How do you get over a year of Twitter analytics?
Twitter analytics only shows you the last 90 days, making it hard to track your progress and compare engagements over time.
Unfortunately, when your analytics only go so far, so does your growth progress.
How can you take action beyond mimicking your monthly best tweet?
To improve your engagement on Twitter, you have to engage with others and get your name out there! Engagement drives your growth, and your Twitter analytics shouldn’t slow you down!
Your engagement rate improves drastically once you go beyond Twitter analytics and find
who the people are behind your engagements.

So, who are the people that are clicking your links? What are their demographics?
The better question is, how can you get more of these people engaging?
Easy. Sort your best tweets by link clicks, for example, and you’ll now know what messages make your audience click. Then, improve those tweets for even more results or use them for other posts!
Using this method, we took our top-performing tweets that drive people to one of our follower mapping tools and tweaked the message to bring even more people to our website:

Within the time frame you choose, you will also see what are your audience’s best words and hashtags. This helps you know precisely what they want you to tweet more about!
You’re also briefed on your top engagers for that time frame, so keep engaging with these followers or target what they talk about at the moment, so all of your tweets are hyper-relevant to active followers.
When you analyze your audience’s sentiment, you’ll also know how to write your messages with the same feelings that your community has for the topics they’re discussing.
This way, you’re writing better messages that drive growth while engaging with active people, making your community livelier and appealing to newcomers!
What is Twitter sentiment analysis?
Twitter sentiment analysis measures the emotion in tweets through specific keywords, emojis, and sentence structures using artificial intelligence. It gives you a breakdown of how much your audience is feeling what emotion.
Fedica’s Follower Sentiment metric does this throughout the day, so you can always read the room whenever you tweet, so you never speak out of context because mistakes like this cause major PR nightmares for brands.

When you know what your followers are talking about and how they feel in the moment, you get a more profound sense of how they feel about specific topics so you can join their conversations and relate to them personally – and avoid inconsiderate mistakes that offend people.
Let us know how you interpret your engagement metrics below if we missed anything!
Key Insights
- Using flexible engagement software with your needs can help you drive more engagements and teach you more about your audience.
- Hop into your audience’s minds by tracking what messages drive the metrics you need.
- Filter your engagements with keywords or sort by the type of engagement to get better ideas on how to write better to drive Twitter growth or conversions!
- Get better Twitter analytics that shows you the people behind your engagements, letting you create accurate personas from active followers.
- Know who your engagements come from, what they talk about and how they feel at every moment!