
X changed the old analytics so its hard to find Twitter analytics now. Just check the pics below!
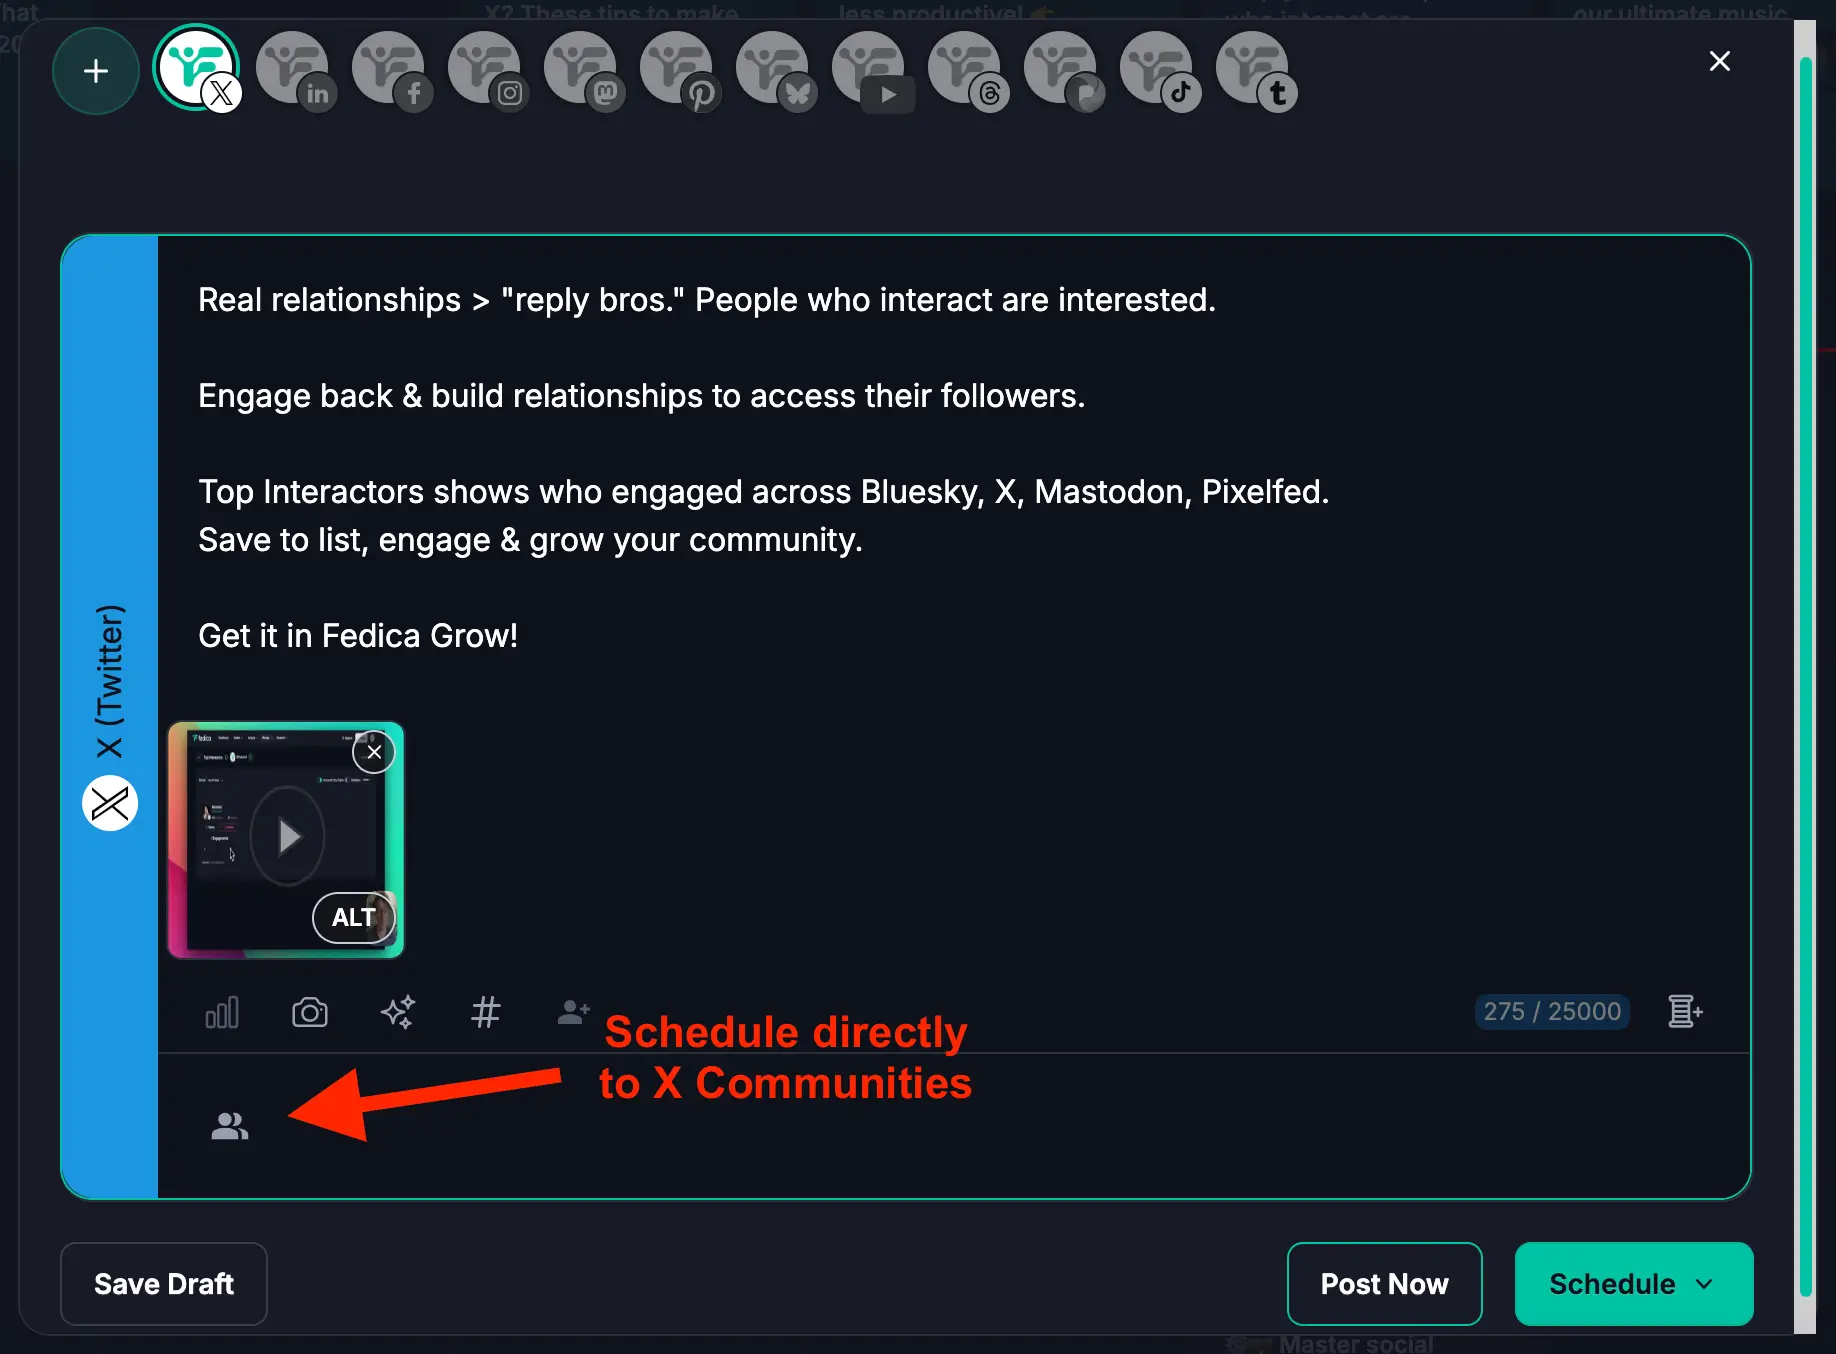
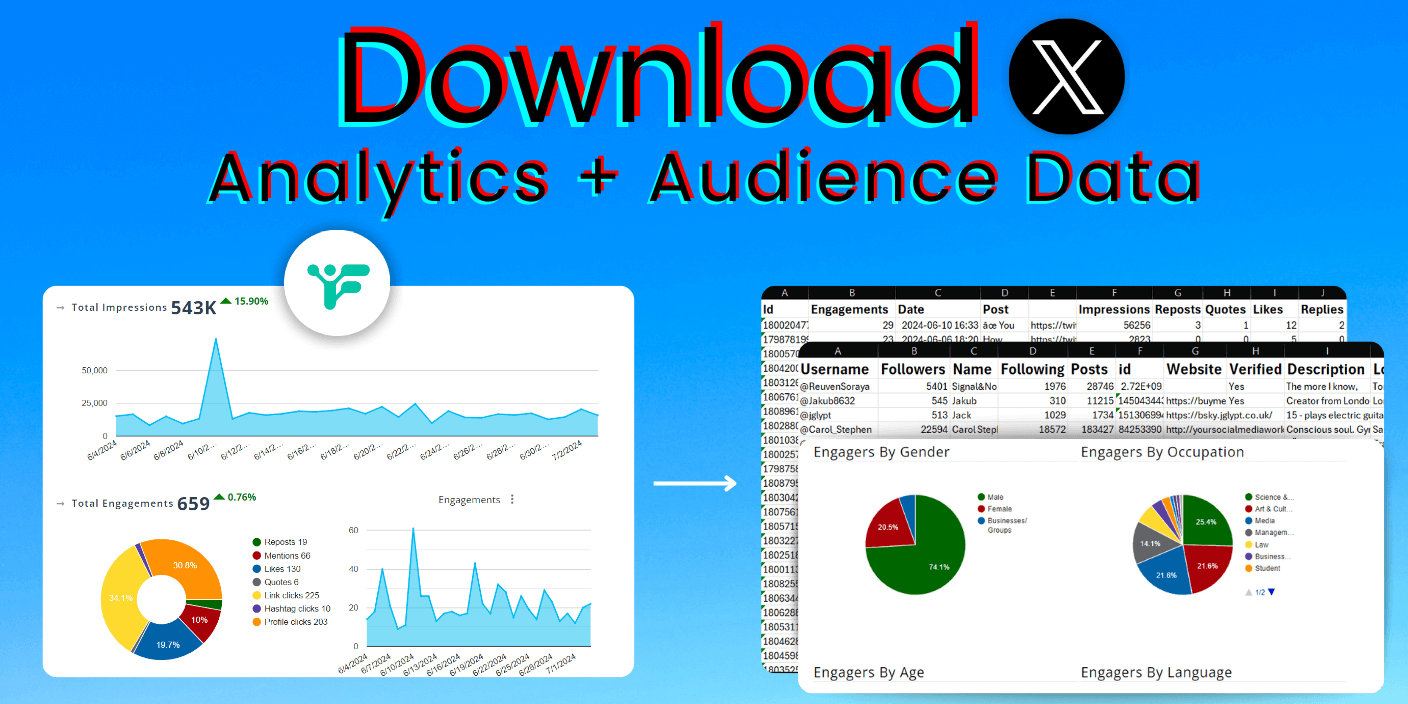
If you’re looking to export detailed Twitter analytics data (beyond simple numbers), get Twitter analytics for another account, filter and sort your analytics, see who engaged, schedule directly to X Communities, that’s all included in Fedica!
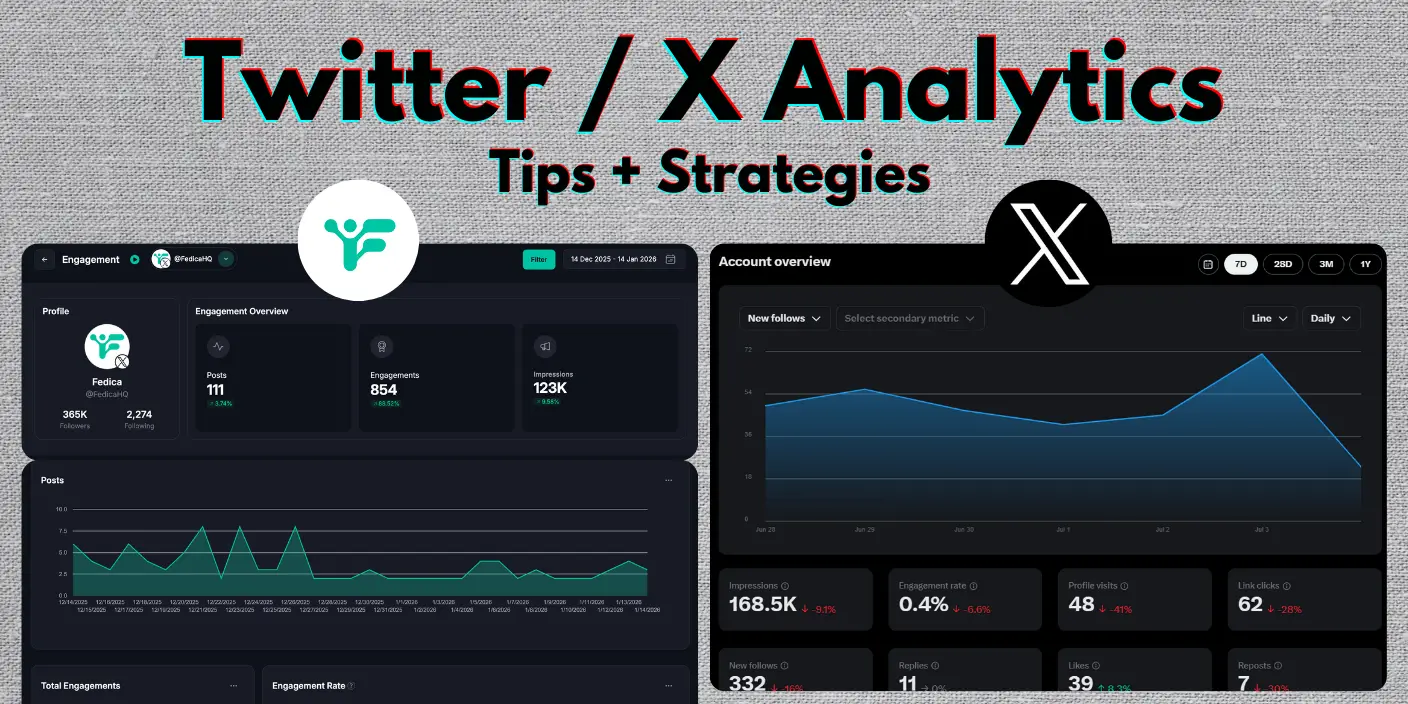
X analytics offers a quick glance at your performance, but they leave you with questions:
- Who’s really engaging with your content?
- What topics resonate most with your audience?
- How do your posts perform over time?
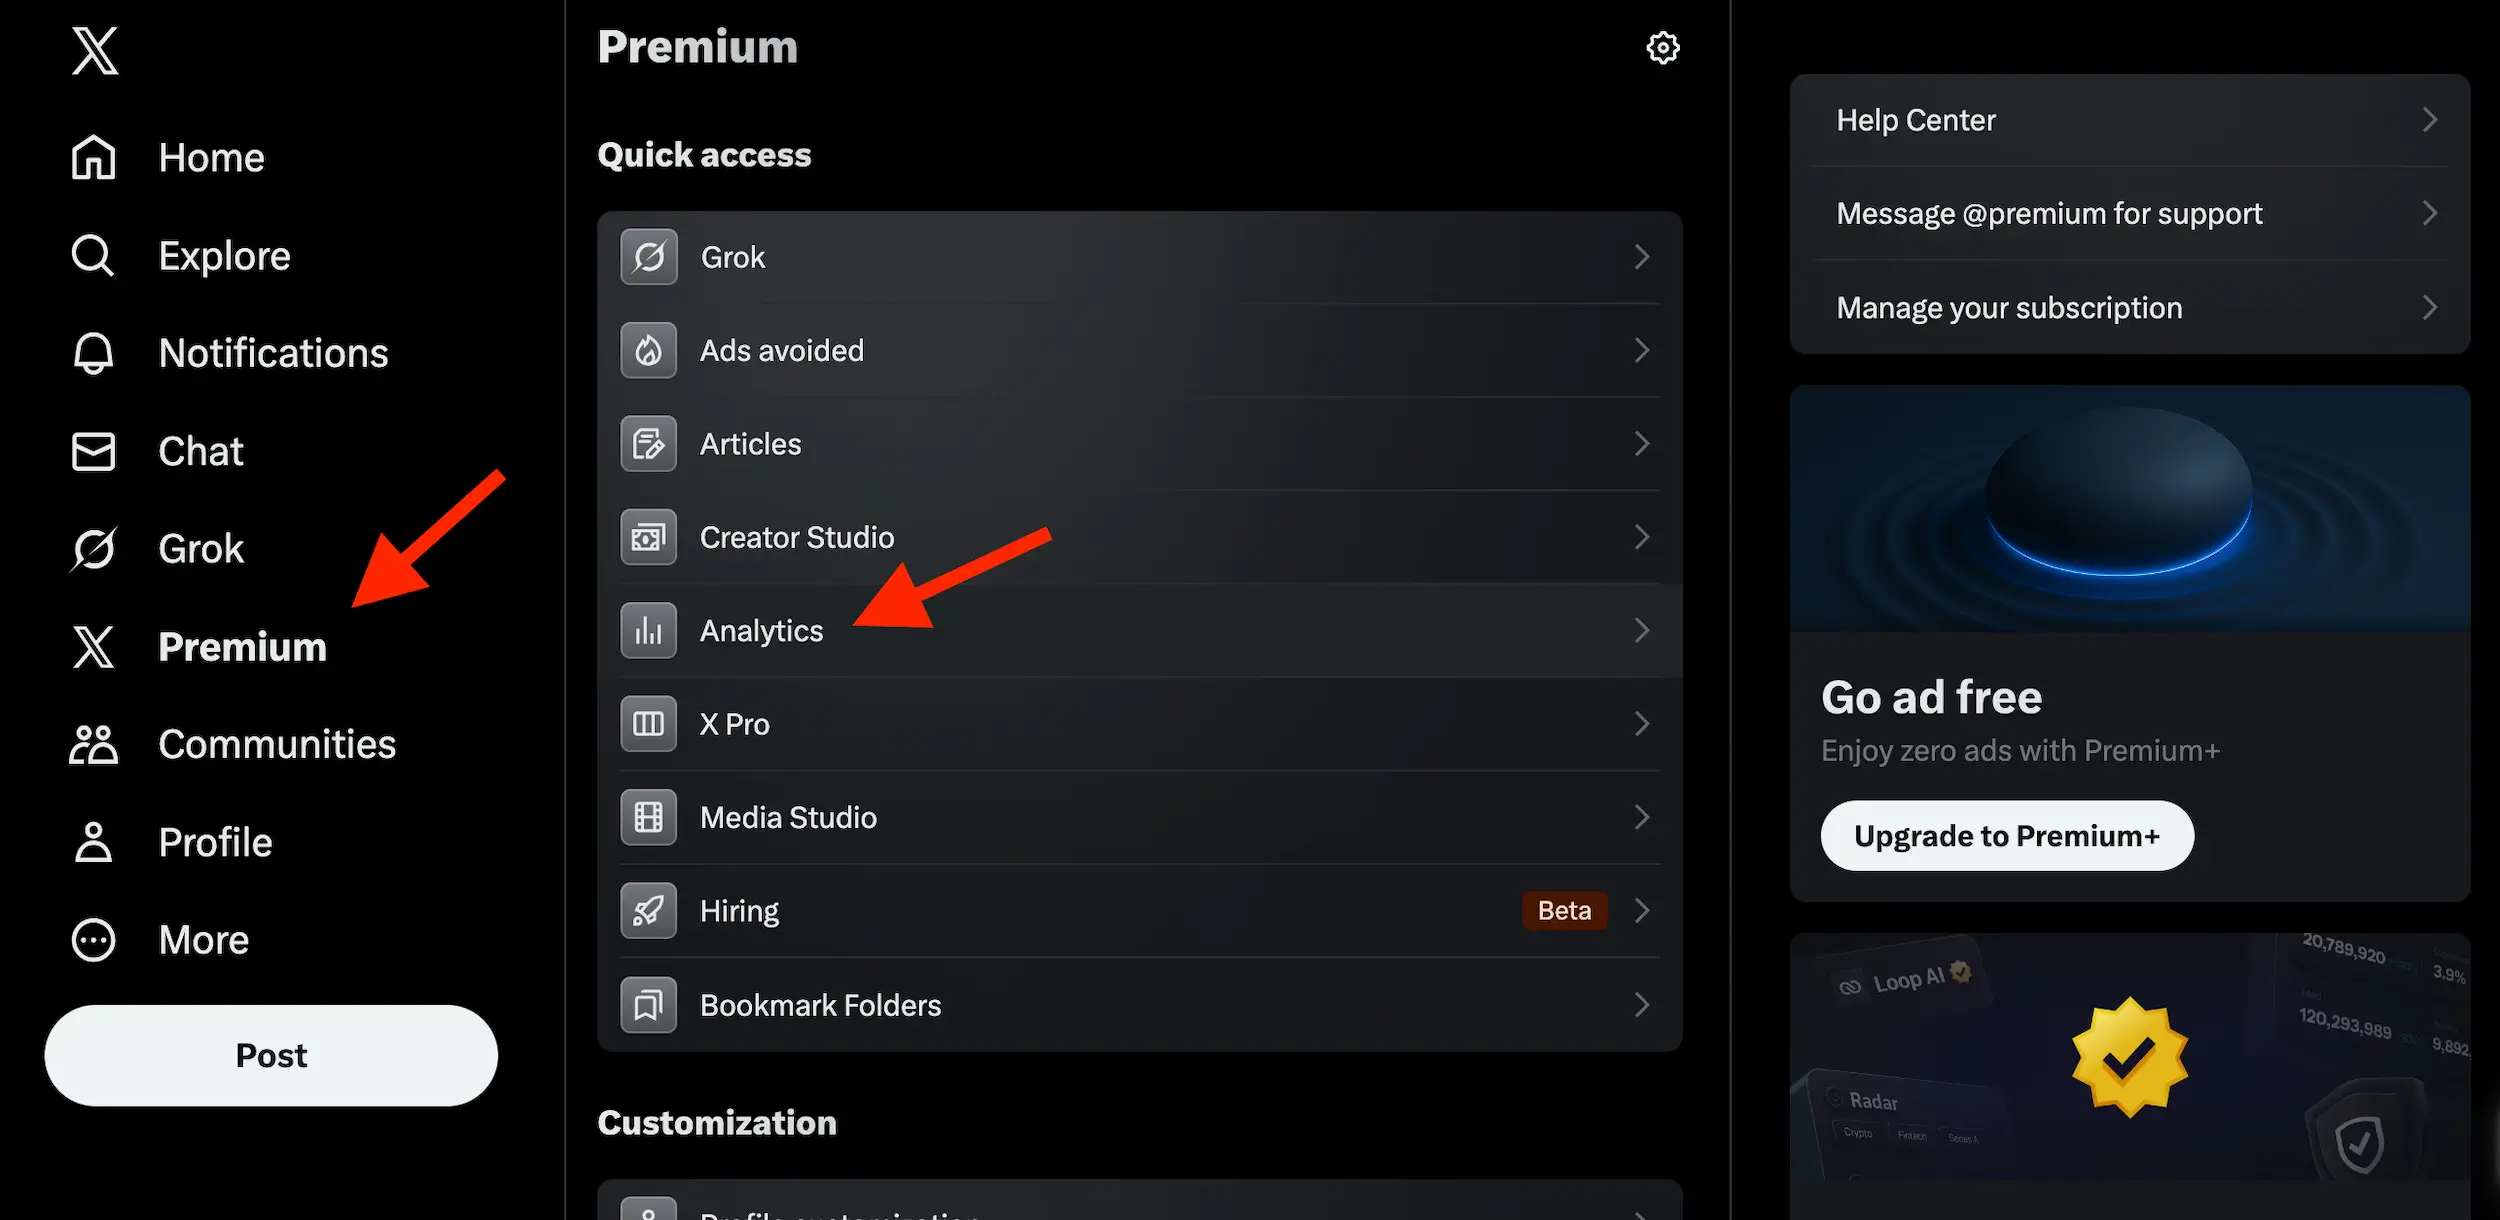
Find Twitter Analytics on X Platform:
- Subscribe to X Premium
- Click “X Premium” on the left panel
- Select “Analytics” under “Quick Access”
- View your basic engagement stats
Skip to a Section:
- Where to Find X Analytics (on mobile)
- Finding More X / Twitter Analytics Data on Fedica…
- How to Reverse-Engineer Growth with X / Twitter Analytics
- Why Basic X / Twitter Analytics Isn't Enough
- X Analytics for Growth? It's Really About the Audience Data
- The Ultimate 2025 Guide to Twitter Analytics: What to Look At, and Why
- Going Deeper: What X / Twitter Analytics Doesn't Show
- Why Use Fedica Over X Premium
- Key Takeaway for X / Twitter Analytics Growth
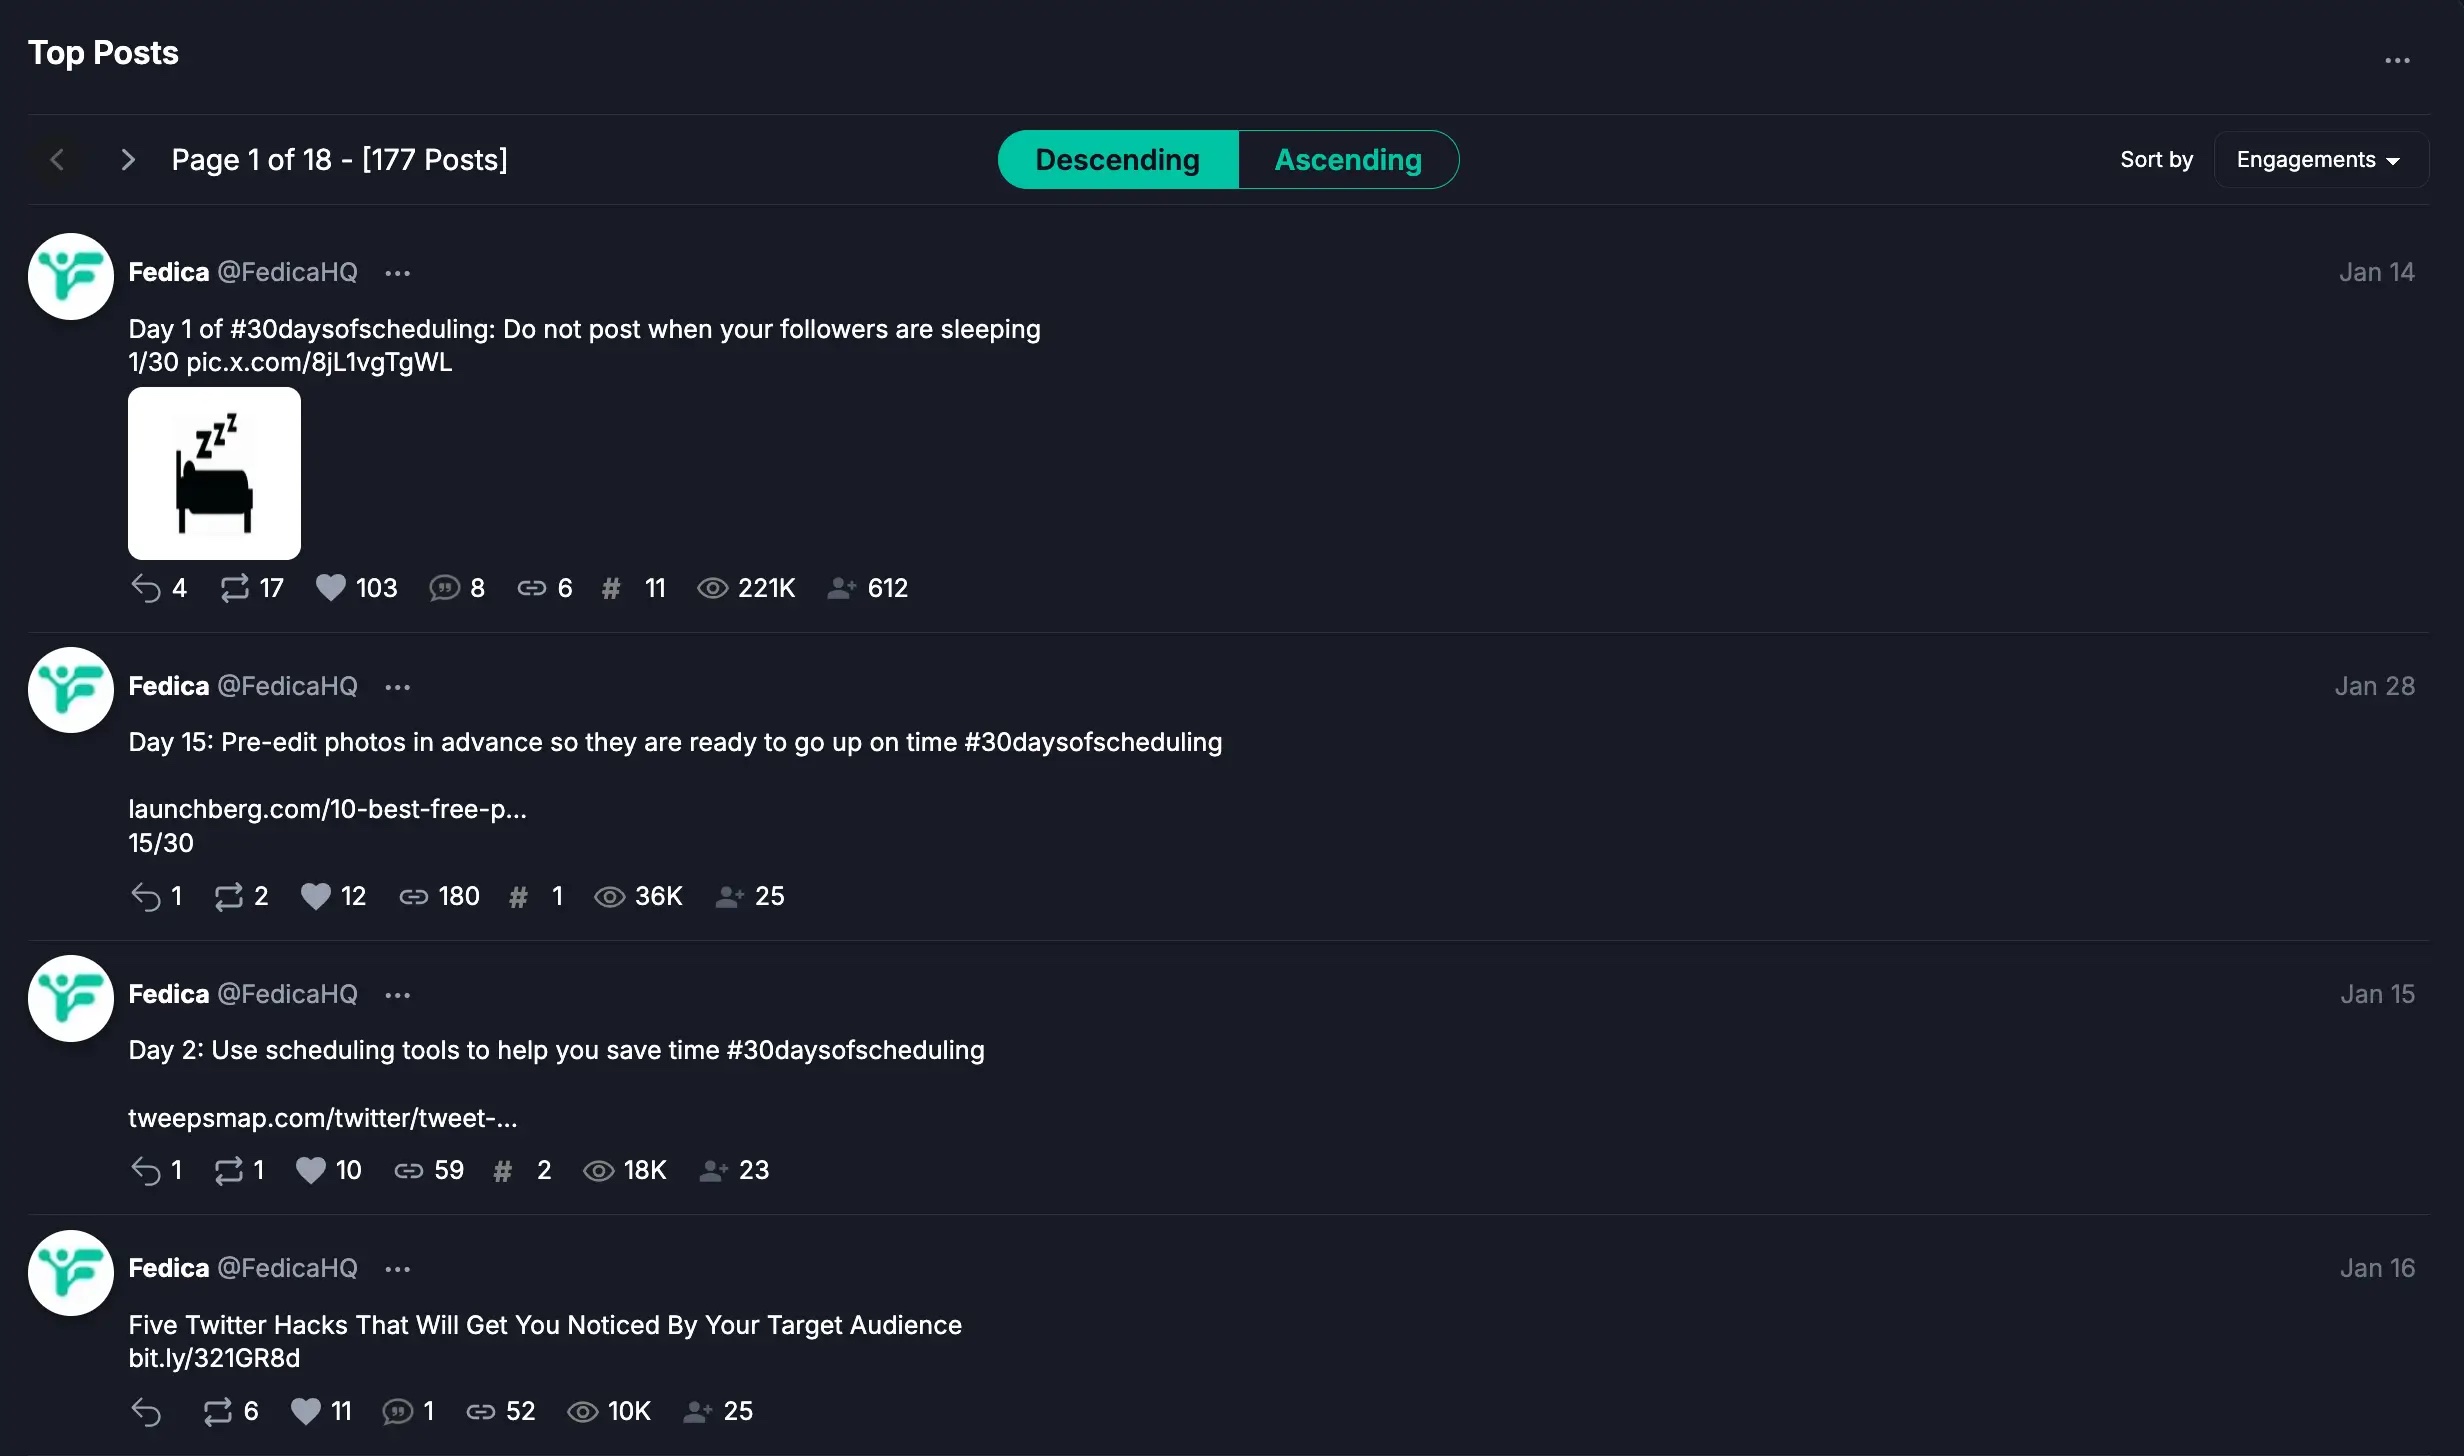
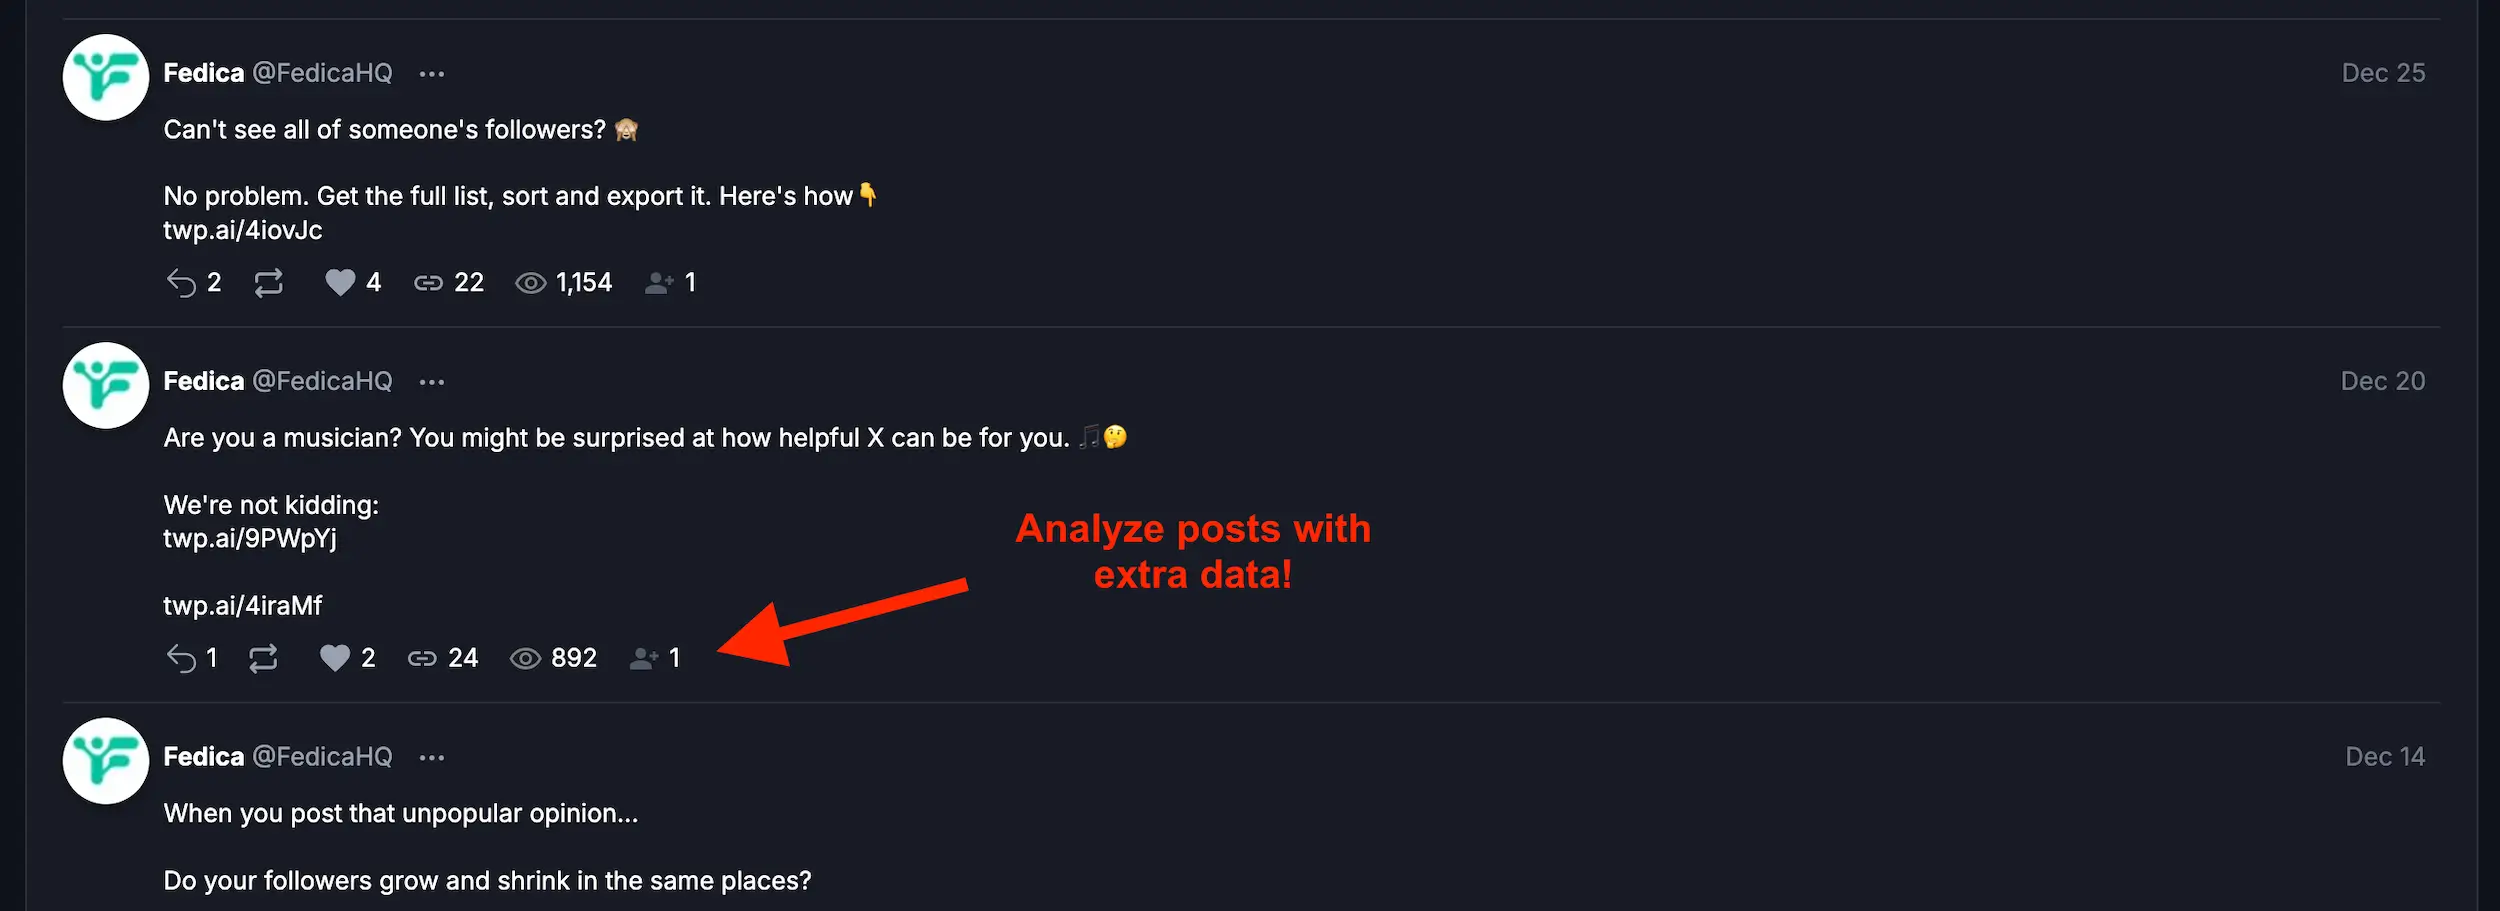
Did you know there are extra metrics that show your best and worst posts relating to each metric?
Without answers to these questions, you’re essentially flying blind.
It’s like trying to navigate a ship with just a compass, you need a radar that provides real-time information about obstacles, currents, and even hidden opportunities ahead.
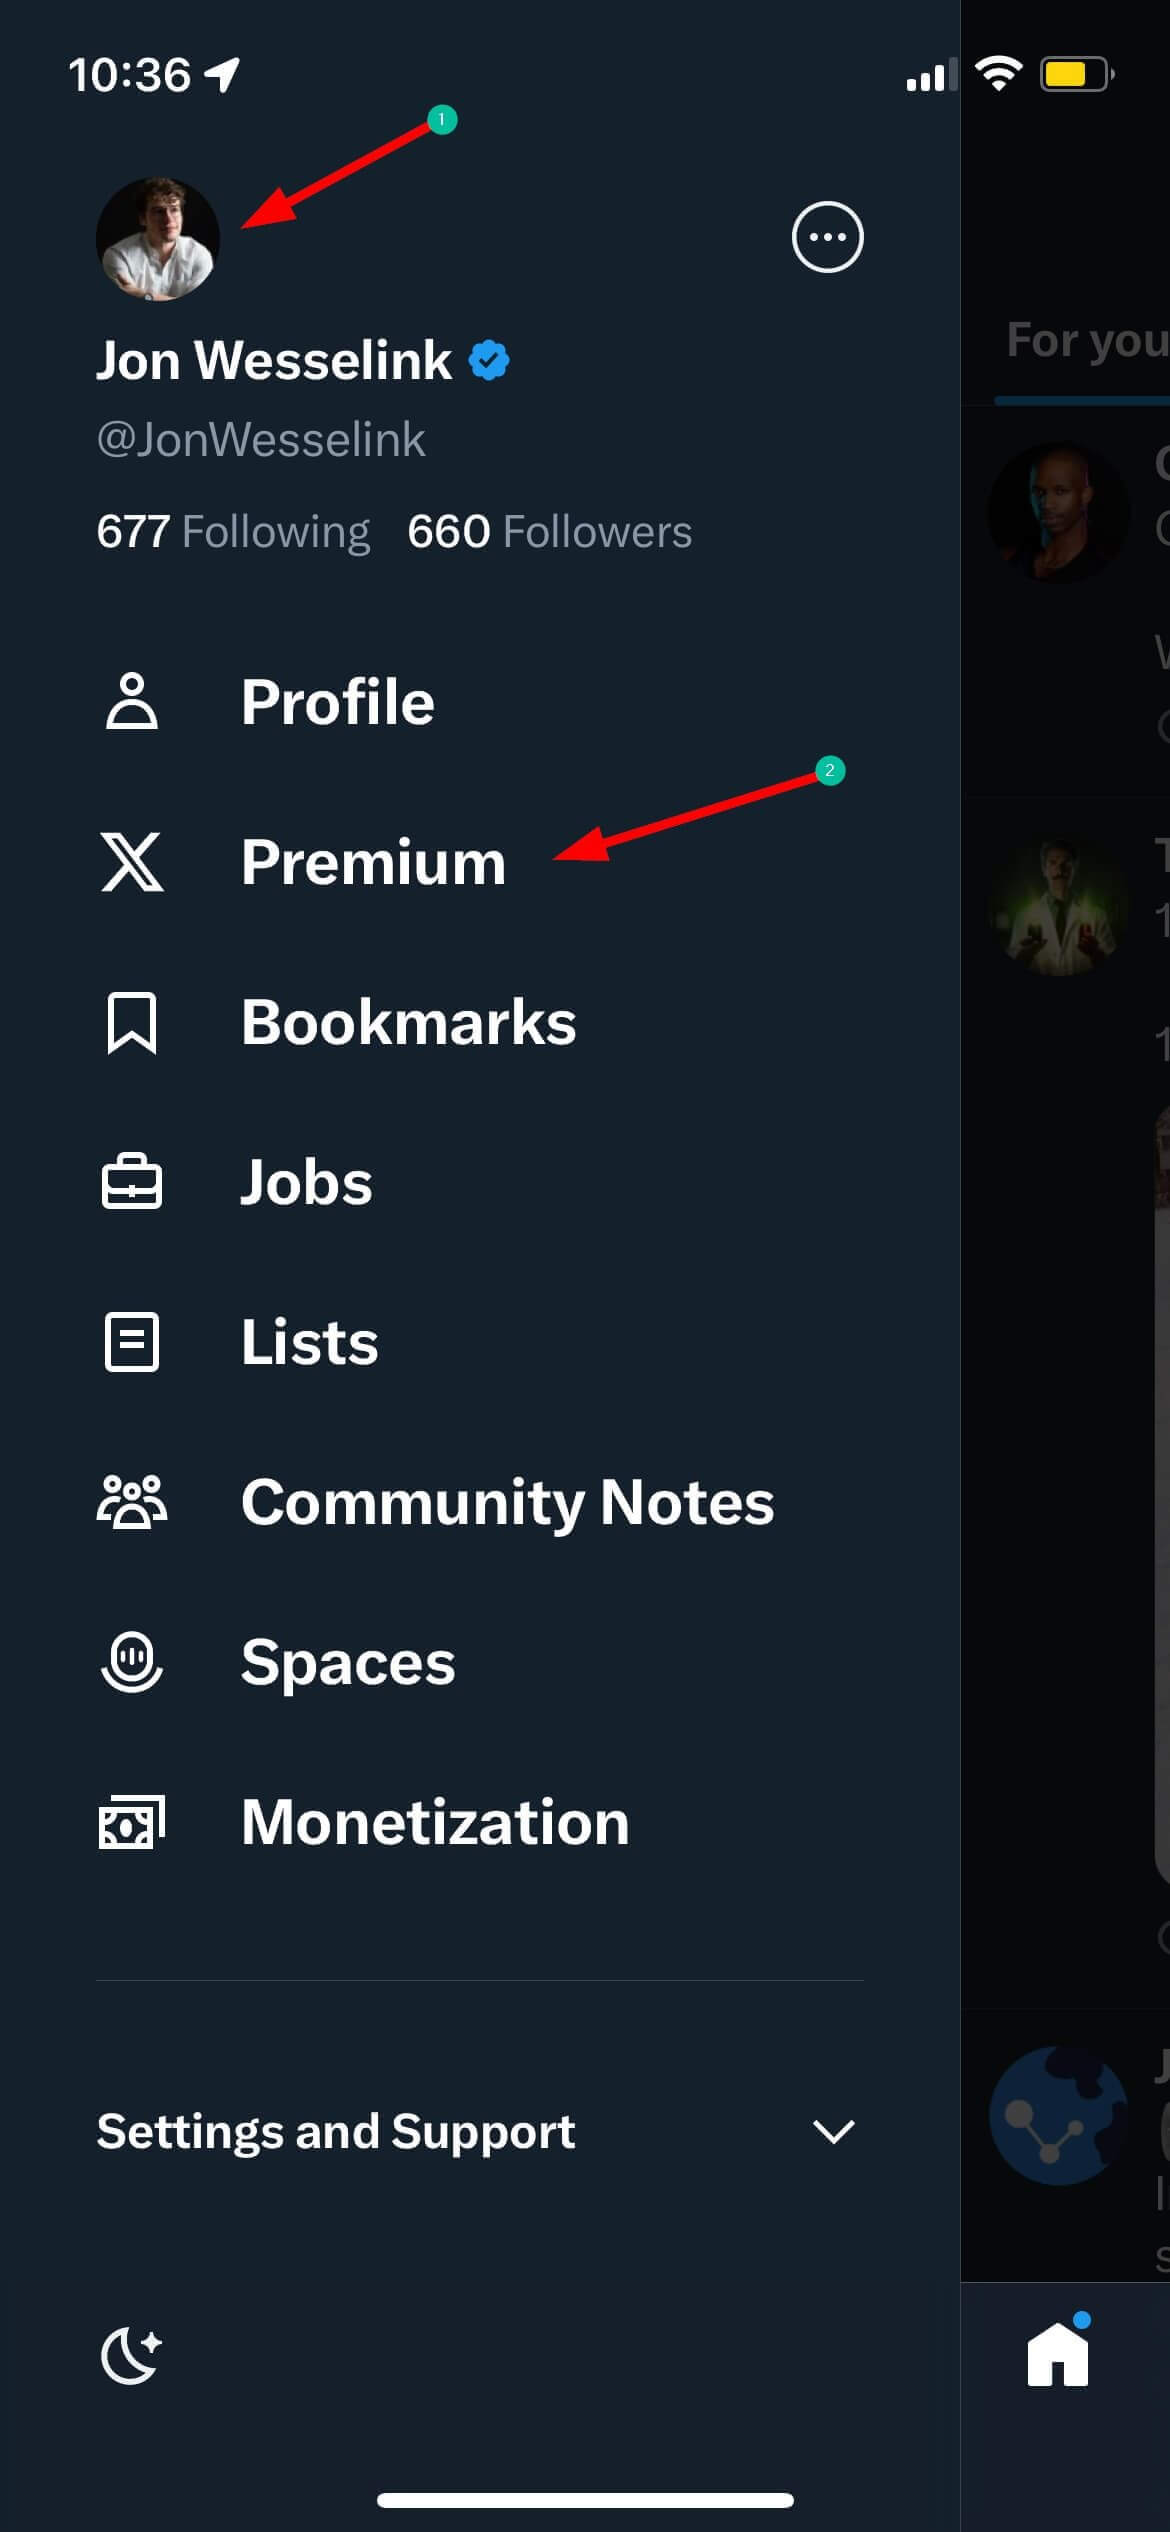
Where to Find X Analytics (on mobile)
On Mobile:
- Tap your profile photo (top-left)
- Tap “Premium”
- Tap “Analytics”
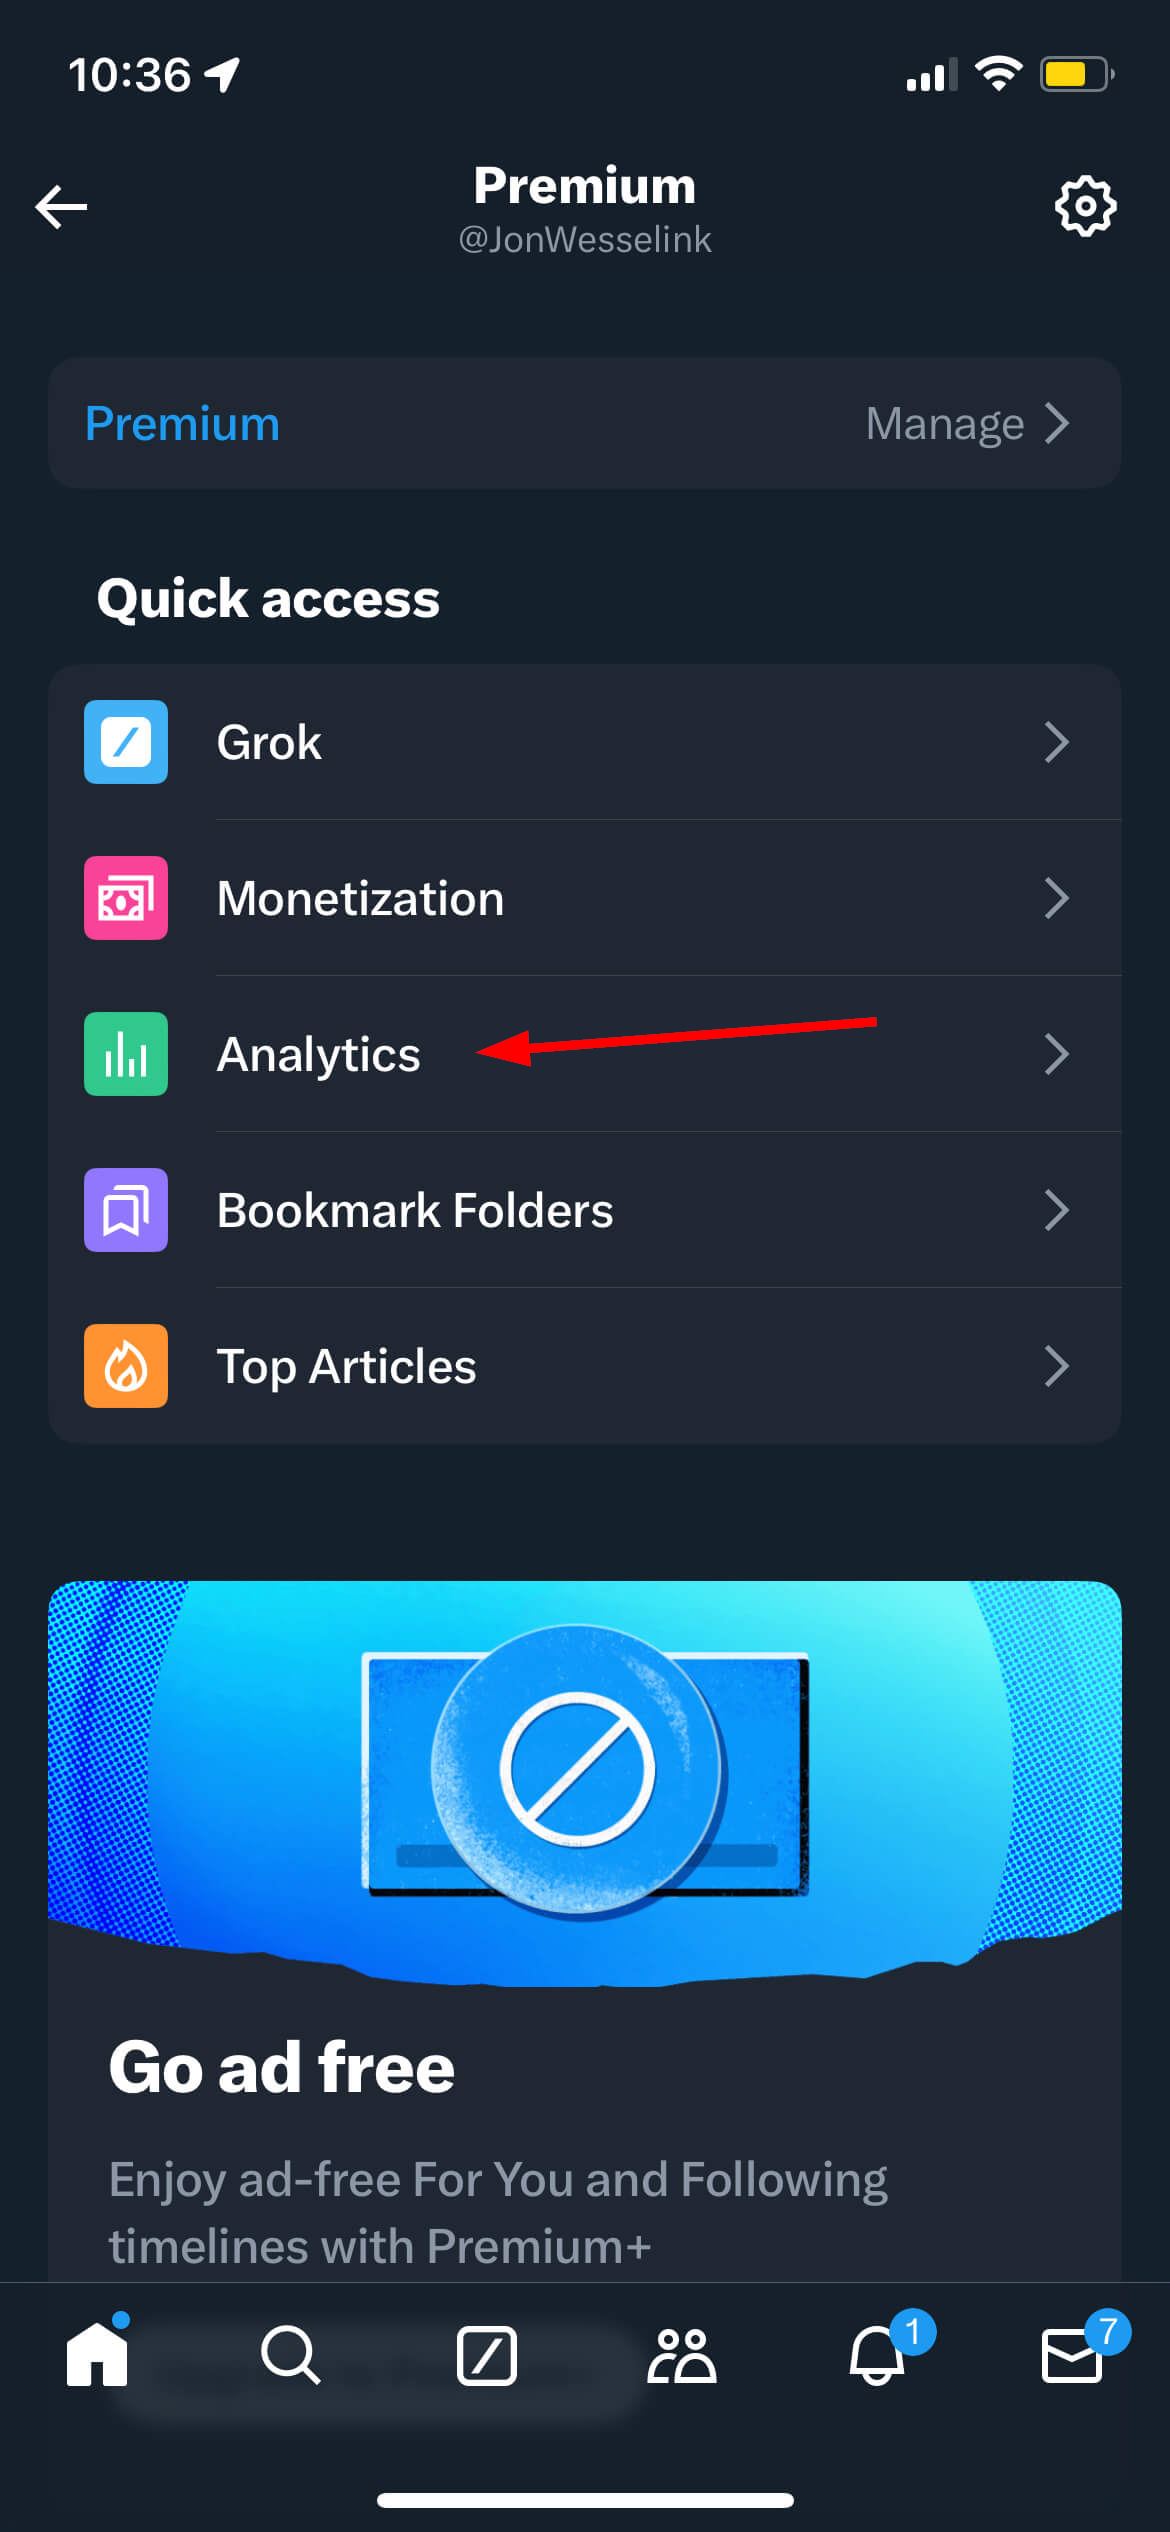
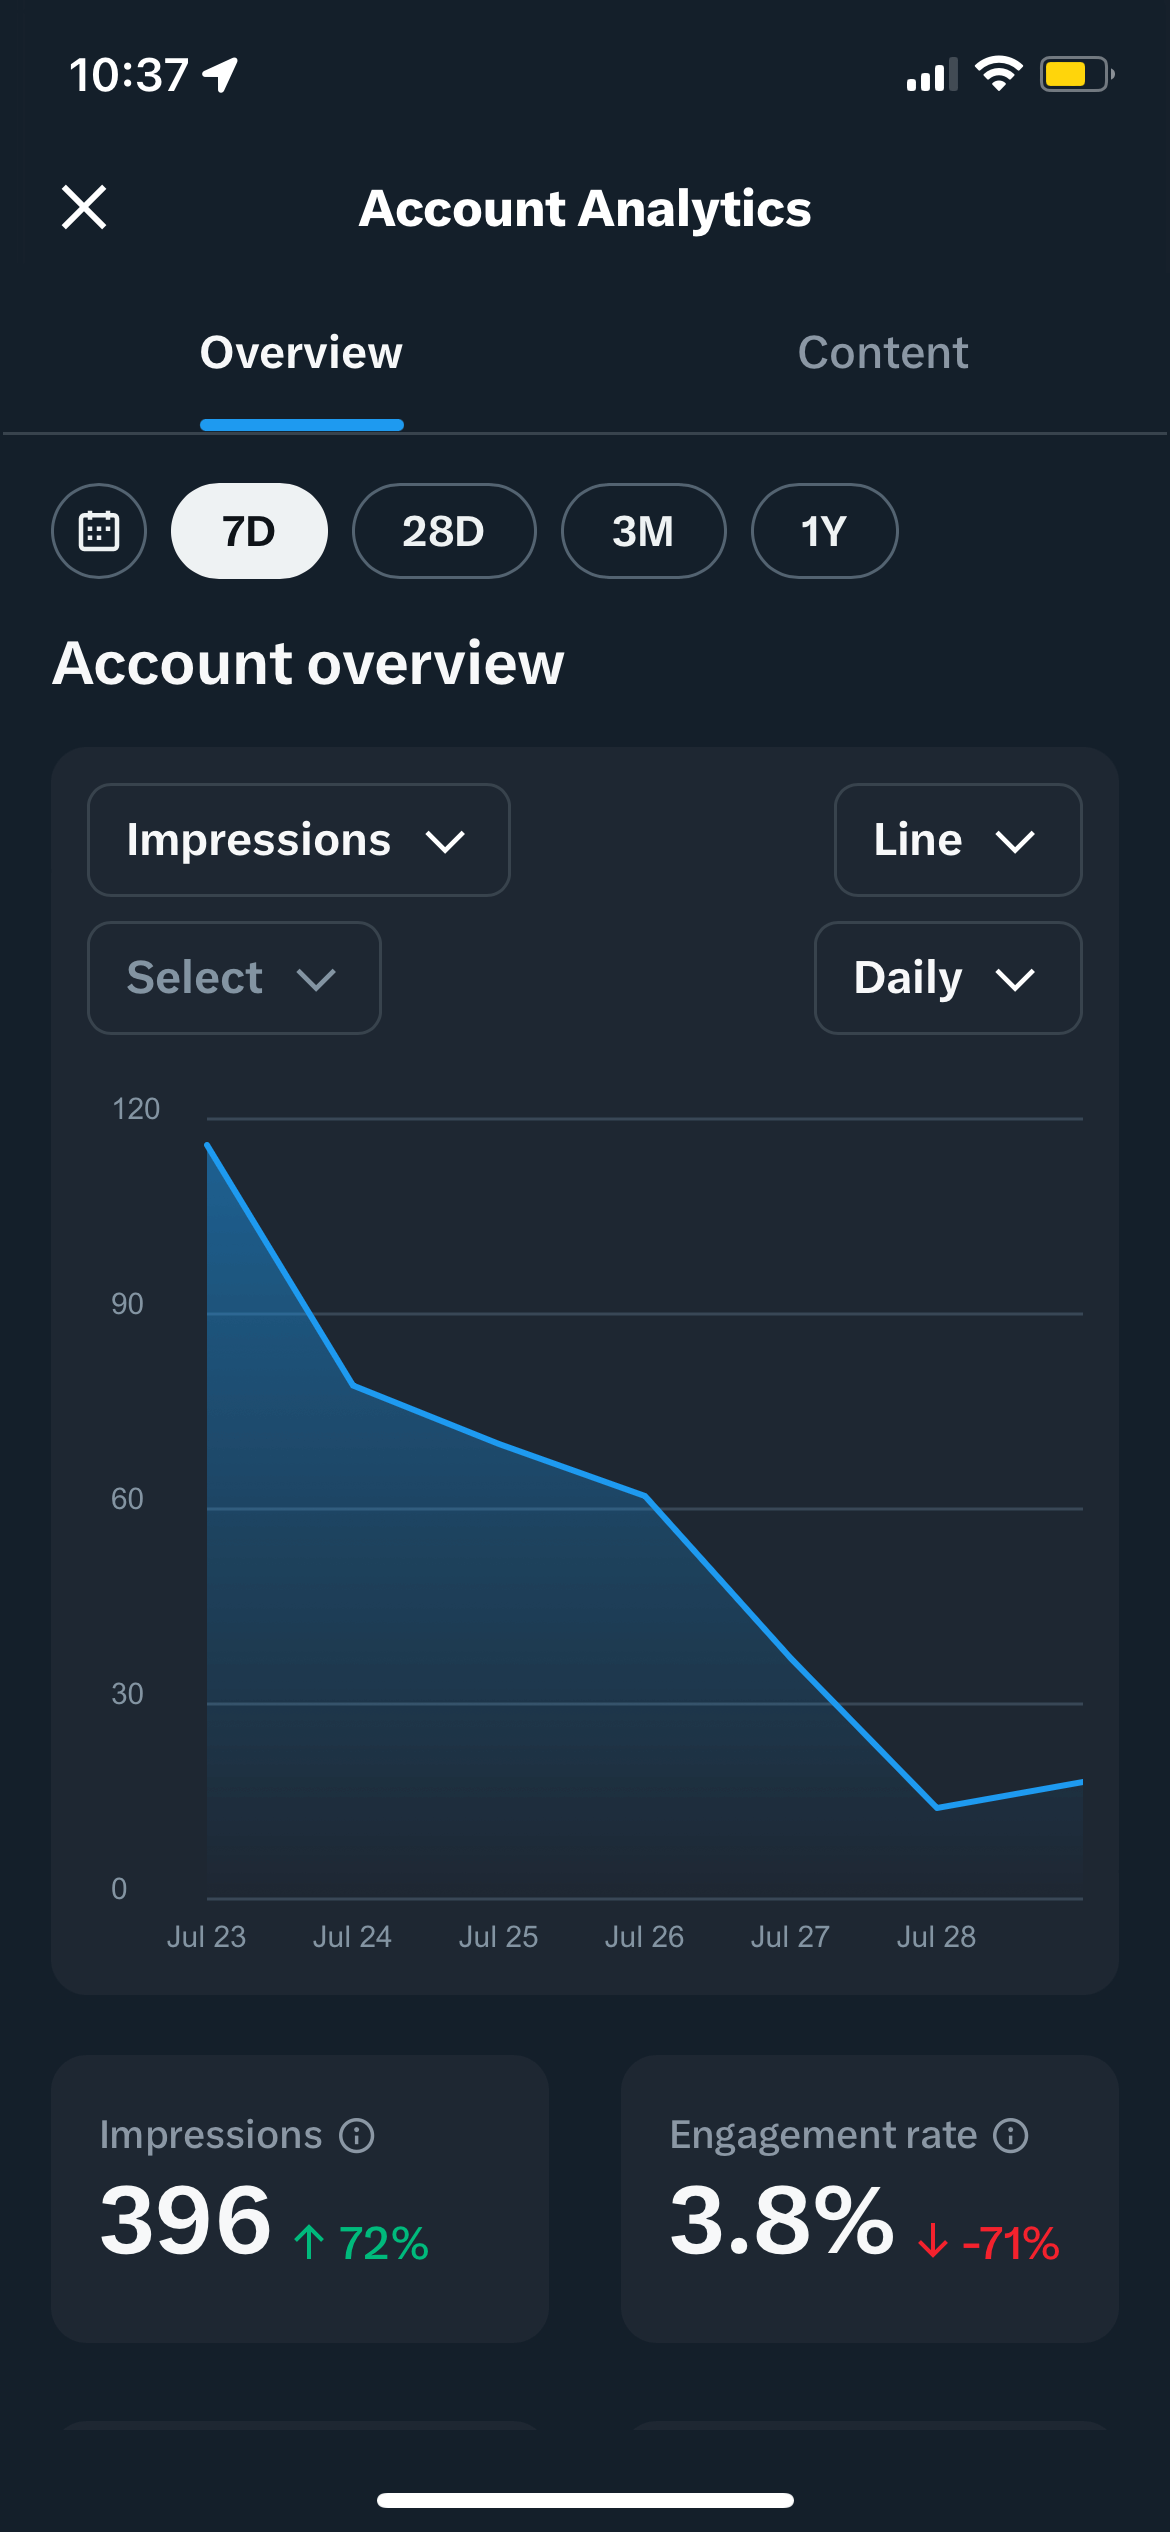
Voila! You’re now in your X analytics dashboard.
This dashboard shows basic engagement stats like impressions, engagement rate, follower count, follow/unfollow numbers, demographics (country, age, gender), and active times. But that’s just scratching the surface, you’re still missing the details that matter.
Finding More X / Twitter Analytics Data on Fedica…
If you want to go deeper to understand what your numbers mean, what actions they suggest, and how to actually grow your account keep reading.
This guide combines practical walkthroughs with strategic insights so you know what works, what doesn’t, and what to post next.
How to Reverse-Engineer Growth with X / Twitter Analytics
Growing your X account begins by asking the right questions about your current performance.
Start by checking your metrics:
- Are you not getting followers?
- Are people not engaging with you?
- Are you attracting the wrong kind of attention?
Advanced analytics can help you pinpoint the areas that need improvement and guide your strategy: Like the right people, the right engagements, etc.
Steps to Use X Analytics for Growth:
- Assess Your Current State.
- Check which metrics fall short. For example, if your follower count is the same or you notice low engagement on key posts, it’s time to dig deeper.
- Ask yourself: Are the people in my analytics the ones I want to attract? If not, it might be time to adjust your content strategy.
- Refine Your Audience.
- Use demographic and audience insights to see who is engaging with your content.
- Example: If your analytics show a large percentage of your audience comes from a specific region or interest group, tailor your content to further engage that community. Conversely, if you find unrelated users, consider strategies to filter your audience or adjust your content.
- Double Down on Top Topics.
- Identify which topics generate the most engagement.
- Use Fedica’s Top Topics analysis to see what your followers are talking about right now (X analytics doesn’t show this).
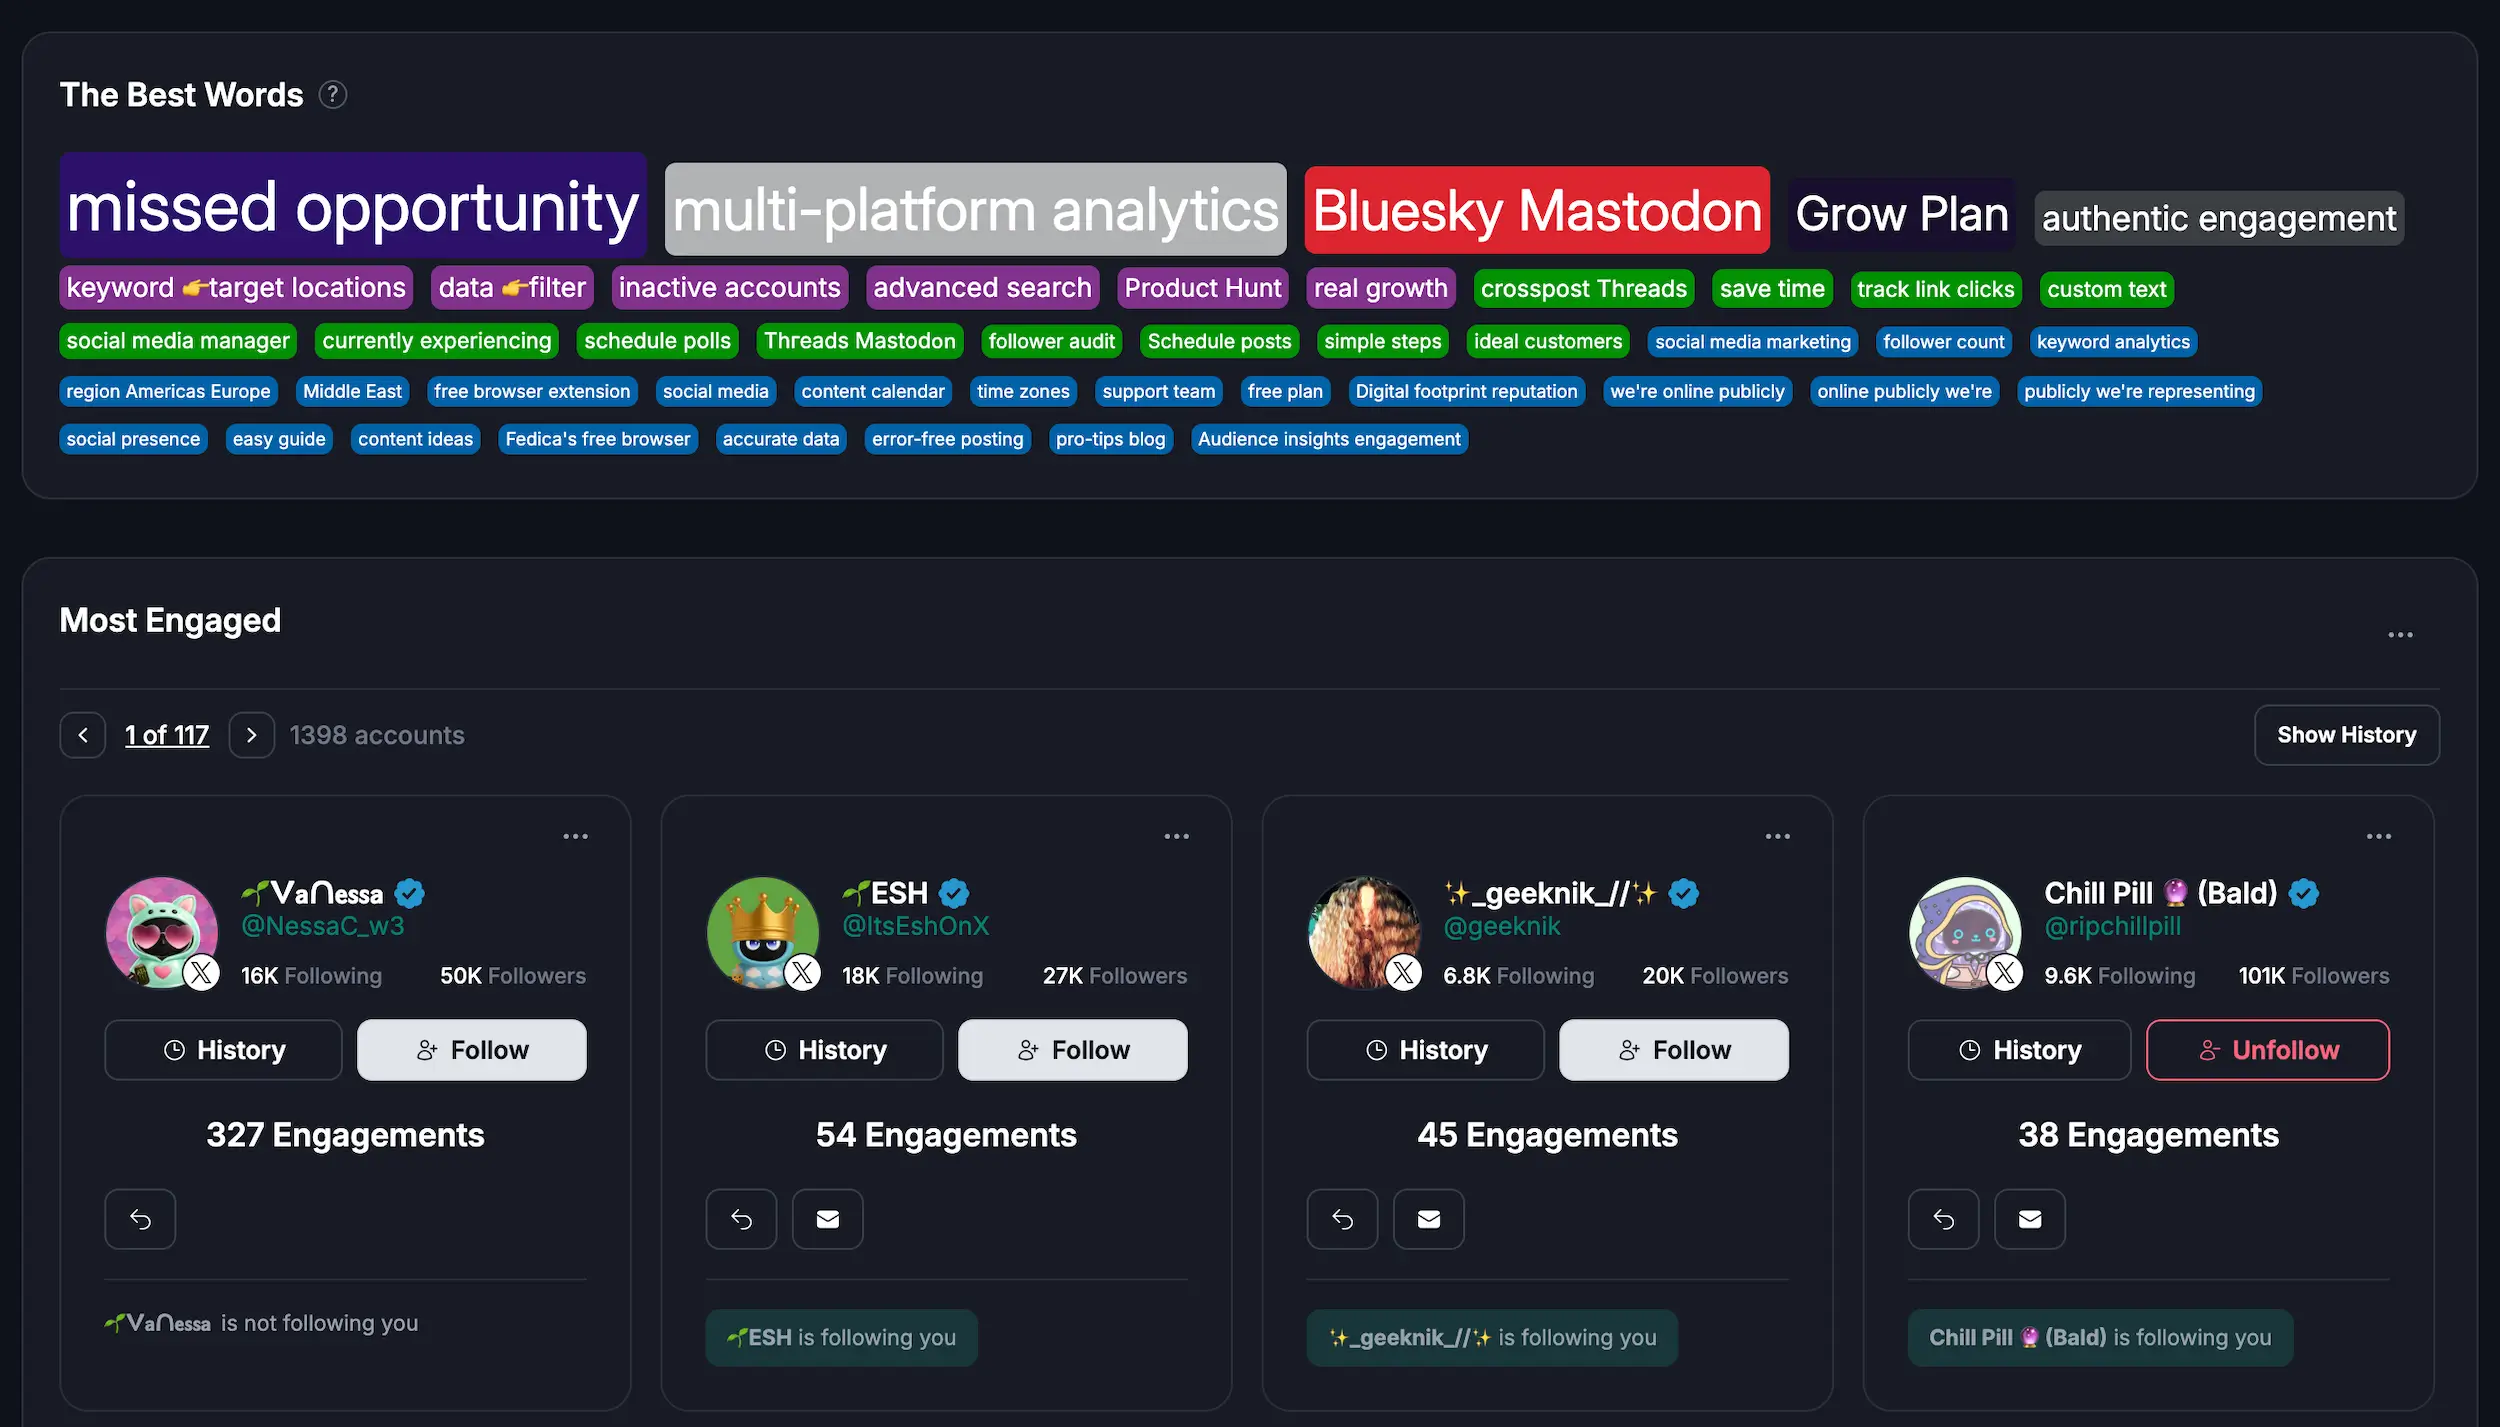
- Use The Best Words feature to see which words and phrases drive the most engagement in your posts.
- Group your analytics by keyword to see which topics consistently perform best.
- Example: If your posts about “social media trends” consistently drive replies and profile clicks, consider creating a series on that subject. Use filters in Fedica to review engagement types, such as likes, replies, and clicks, to determine the most impactful content.
- Implement Targeted Improvements.
- Once you know what works, focus on tweaking successful posts.
- Example Post: “How I Doubled My Engagement by Focusing on Community Interests”
- Briefly describe the initial challenge, the analytical insights you uncovered, and the steps you took to adjust your content.
- Highlight stats before and after your changes to showcase growth.
- Continuous Iteration.
- Regularly review your analytics to check if your strategy is working.
- Adjust your content based on new data and trends, ensuring that you always focus on attracting the right audience.
Your analytics become more than just numbers when you think like this.
They transform into a roadmap for building a community that aligns with your goals.
Here’s a real example: When we started tracking thread performance using Fedica’s analytics, we discovered that our spread threads consistently outperformed other formats. After adjusting our strategy, we increased impressions by over 2,000%.
- Post more of what’s working
- Refine tone, format, and CTA for underperforming content
- Align your content to audience interests (Fedica shows follower interests + professions)
Why Basic X / Twitter Analytics Isn’t Enough
X analytics gives a quick glance at your performance, but it leaves out the details:
- Who’s actually engaging with your posts? (X only shows counts, not individual accounts)
- Who unfollowed you? (X only shows daily numbers, not who)
- Which topics perform best? (X doesn’t filter by keyword/topic)
- What content leads to follower growth?
- Where is your audience located beyond country? (X only shows country-level)
- What professions does your audience have? (X doesn’t show this)
- How did you perform beyond 1 year ago? (X deletes data after 1 year)
Here’s a quick side-by-side comparison:
What X Analytics Offers:
- Impressions
- Engagement rate
- Follower count and verified follower count (numbers only, not lists)
- Follow/unfollow tracking (daily numbers only, not who unfollowed)
- Demographics: Country, age, gender (aggregate numbers, not individual users)
- Active times (timezone unclear)
- Basic content-level metrics
- Export (limited to simple numbers only, not detailed reports)
What Fedica Adds:
- Engagements tied to actual user accounts (see WHO engaged, not just counts)
- See WHO unfollowed (not just daily numbers)
- Complete follower and verified follower lists (not just counts)
- Top interactors list (your most engaged users)
- Top followers list (your most influential followers)
- Real influencer list (accounts following you with lots of followers that also overlap with your followers)
- Keyword filtering and topic clustering
- Content grouping by keyword (organize analytics by topics)
- The Best Words analysis (see which words/phrases drive most engagement)
- Top topics analysis (see what topics your followers are talking about now)
- Post reach tracking (track how far your posts spread beyond impressions)
- Post alerts (get notified when specific keywords/topics are mentioned)
- Timeline analysis (analyze any X account’s posting patterns)
- Real-time listening (monitor keywords/hashtags as conversations happen)
- Find common followers between accounts (for collaboration opportunities)
- Detailed exportable reports (not just simple numbers)
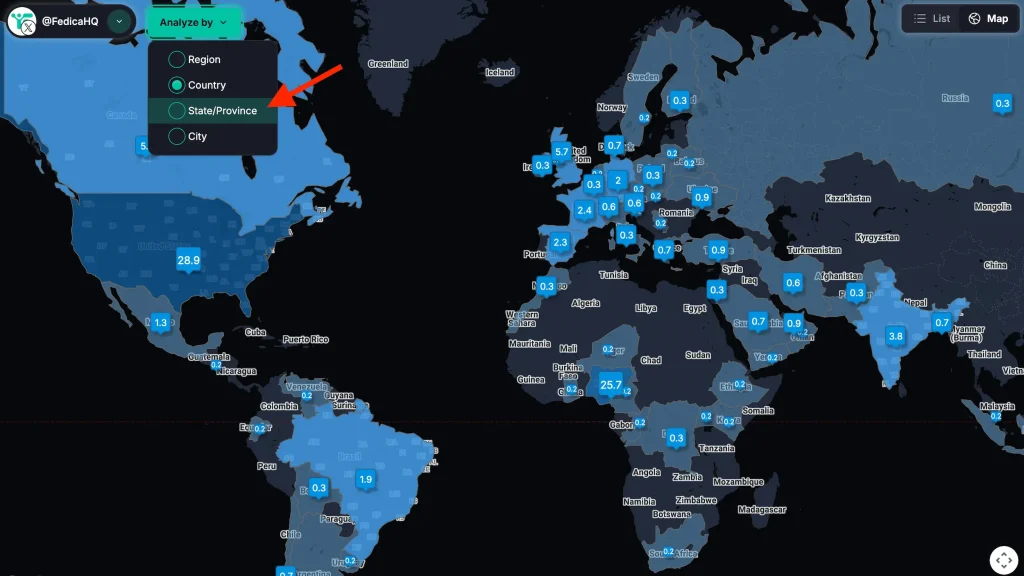
- Audience demographics: Region, state, city, profession, occupation (not just country)
- Geo-mapping down to city level
- Long-term performance trends and post sorting (beyond 1 year limit)
- Historical insights across multiple years (data retention beyond X’s 1-year limit)
- Sentiment filtering (filter analytics by sentiment to understand audience reactions)
What Fedica’s Follower Analytics Adds:
- X Bot detection: Keep your follower list authentic
- Track Unfollowers: See WHO unfollowed (not just daily numbers like X shows)
- See all Verified followers: Complete list of verified followers (X only shows the count)
- See and sort all followers: Complete follower lists (X only shows counts), access complete follower information and sort everyone with filters and keywords
- Top interactors list: See your most engaged users (X only shows aggregate engagement counts)
- Top followers list: See your most influential followers (X only shows follower count, not who they are)
- Real influencer list: Identify accounts following you who have lots of followers that overlap with yours (X does not have this)
- Find common followers: See shared followers between your account and competitors/partners for collaboration opportunities
X analytics gives a quick glance at your performance, but it leaves out the details:
- Who’s actually engaging with your posts? (X only shows counts, not individual accounts)
- Who unfollowed you? (X only shows daily numbers, not who)
- Which topics perform best? (X doesn’t filter by keyword/topic)
- What content leads to follower growth?
- Where is your audience located beyond country? (X only shows country-level)
- What professions does your audience have? (X doesn’t show this)
- How did you perform beyond 1 year ago? (X deletes data after 1 year)
If you’re looking to export detailed Twitter analytics data (beyond simple numbers), see WHO engaged or unfollowed, analyze another account, sort and filter by keywords, understand your audience beyond country-level demographics, or access historical data beyond 1 year, you’ll need more than the basic X dashboard. That’s where Fedica comes in.
X Analytics for Growth? It’s Really About the Audience Data
Here’s what happens when you can see who actually shows up for your content: you stop guessing about your audience and start understanding it. But understanding alone doesn’t grow your account—action does.
X analytics gives you numbers. But growth happens when you use those numbers to find the right people to connect with, engage with, and build relationships with. That’s where audience data tools come in.
Here’s how it works:
Your analytics show you which topics perform best and who engages with them. But then what? You need to take action on that data:
- Use your Top Interactors list to see your most engaged users—the people who consistently like, reply, and share your content. These are your champions. Engage with them, support their content, and build real relationships. X analytics only shows aggregate engagement counts, not who these people are.
- Use your Real Influencer list to identify verified and influential accounts following you. These are potential collaboration partners, people who can amplify your reach, or accounts worth building relationships with. X only shows you a follower count, not who these influential followers actually are.
- Use your Top Followers list to see your most influential followers. These are people worth engaging with regularly, accounts that can help you reach new audiences, or followers who align with your goals. X doesn’t show you this—you only see a number.
- Search accounts to find leads, influencers, or people in your niche. Use filters like keywords in bio, location, follower count, and engagement level to find exactly who you’re looking for. Export lists of accounts to engage with, collaborate with, or reach out to. X analytics doesn’t help you find new people—it only shows you who already follows you.
- Find common followers between your account and competitors or partners. See shared audiences to identify collaboration opportunities, discover ideal niches, or understand your competitive landscape. X doesn’t offer this comparison.
This is the difference between posting blindly and posting strategically. When you know who engages with what, you can:
- Identify your top supporters and build relationships with them
- Find influencers and collaborators who align with your audience
- Discover new people to connect with based on your best-performing content
- Understand your competitive landscape and find opportunities
- Turn analytics insights into actionable outreach
X analytics tells you what’s working. Fedica’s audience tools help you do something about it. That’s how you grow—not just by understanding your numbers, but by using that understanding to connect with the right people.
The workflow: Analytics → See who engages → Use Top Interactors/Real Influencers/Top Followers → Search for similar accounts → Find common followers → Engage and build relationships → Grow.
Analytics alone won’t grow your account. But analytics combined with audience data tools? That’s how you turn insights into growth.
The Ultimate 2025 Guide to Twitter Analytics: What to Look At, and Why
Using Twitter analytics can feel overwhelming. You’ve got numbers, now what? Here’s how to break it down.
One of the most powerful but underutilized insights in Fedica is the ability to see exactly who is engaging with your content. Not just how many, but which accounts.
This means you can:
- Identify the specific people who consistently engage with your content
- Create a saved list of your top supporters and “champions”
- Take intentional action to build real relationships: like their posts, reply to their content, and reshare their best work
By doing this consistently, you’re creating a feedback loop. Support them, and they’re far more likely to keep supporting you.
Even better, you can apply filters to see who’s engaging with posts on specific topics, then check whether they match the audience you’re trying to attract. For example, if you post about SaaS marketing and notice the people engaging aren’t in your target segment, it’s a clear signal to adjust your messaging.
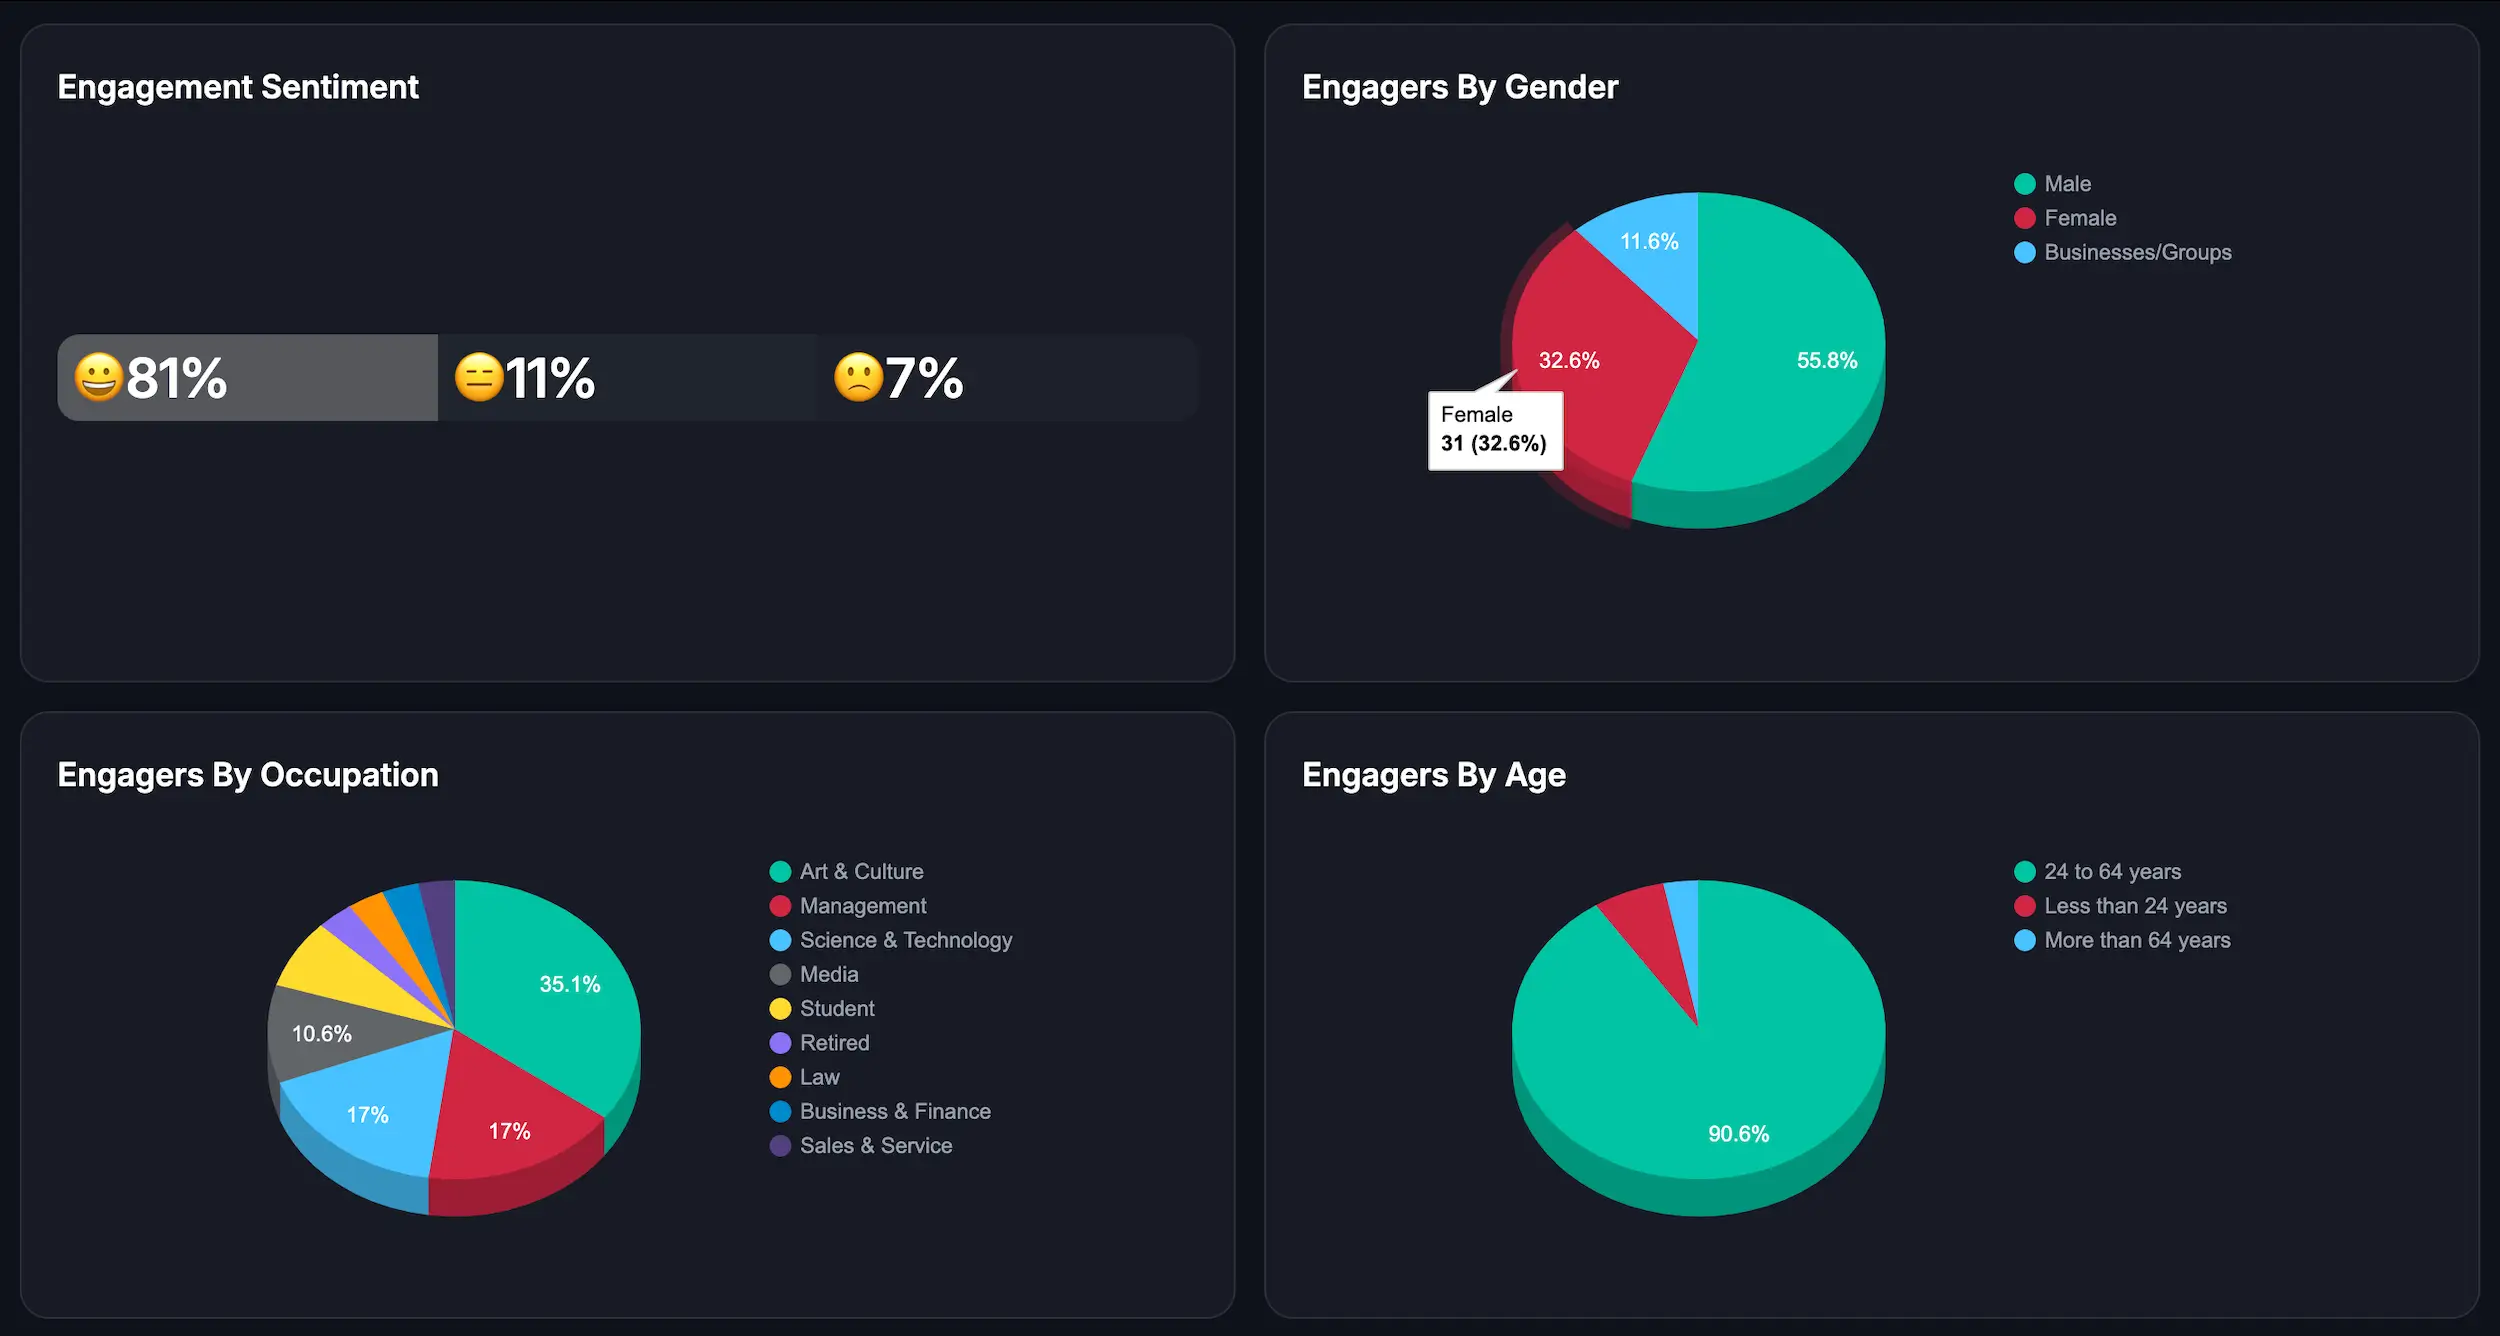
You also get access to demographic breakdowns of these engaged users, including region, state, city, language, gender, and profession, data X analytics doesn’t provide (X only shows country, age, and gender as aggregate numbers). This gives you full visibility into not only what is performing but who it’s resonating with.
This shifts analytics from generic reporting into actionable strategy. Instead of guessing, you can:
- See who’s engaging with which topics
- Evaluate if they align with your goals
- Double down on the right content to grow the right audience
Using Twitter analytics can feel overwhelming. You’ve got numbers, now what? Here’s how to break it down.
1. Impressions: Who’s Seeing Your Content?
Start by looking at impressions to gauge how visible your content is. If impressions are low:
- Test new post formats (videos, polls)
- Use hashtags strategically
- Post when your audience is most active (Fedica auto-detects this with timezone clarity—X shows active times but timezone is unclear)
2. Engagements: Is Your Content Resonating?
Look at likes, replies, shares, and profile clicks.
- High impressions + low engagement? Rethink your tone or CTA.
- High replies but low likes? Check if the content triggered debate or confusion.
3. Profile Visits: Did They Care Enough to Learn More?
- Optimize your bio, pinned post, and profile image
- Include CTAs in high-performing tweets
4. Followers: Who’s Joining You?
- Track which posts led to spikes in followers
- Ask: Were those posts aligned with your goals?
- Use Fedica to see WHO unfollowed (X only shows daily numbers) and analyze audience quality
5. Content-Type Insights: What Format Works?
- X shows post type performance (text, image, video)
- Fedica lets you filter by keyword to identify top-performing topics
Going Deeper: What X / Twitter Analytics Doesn’t Show
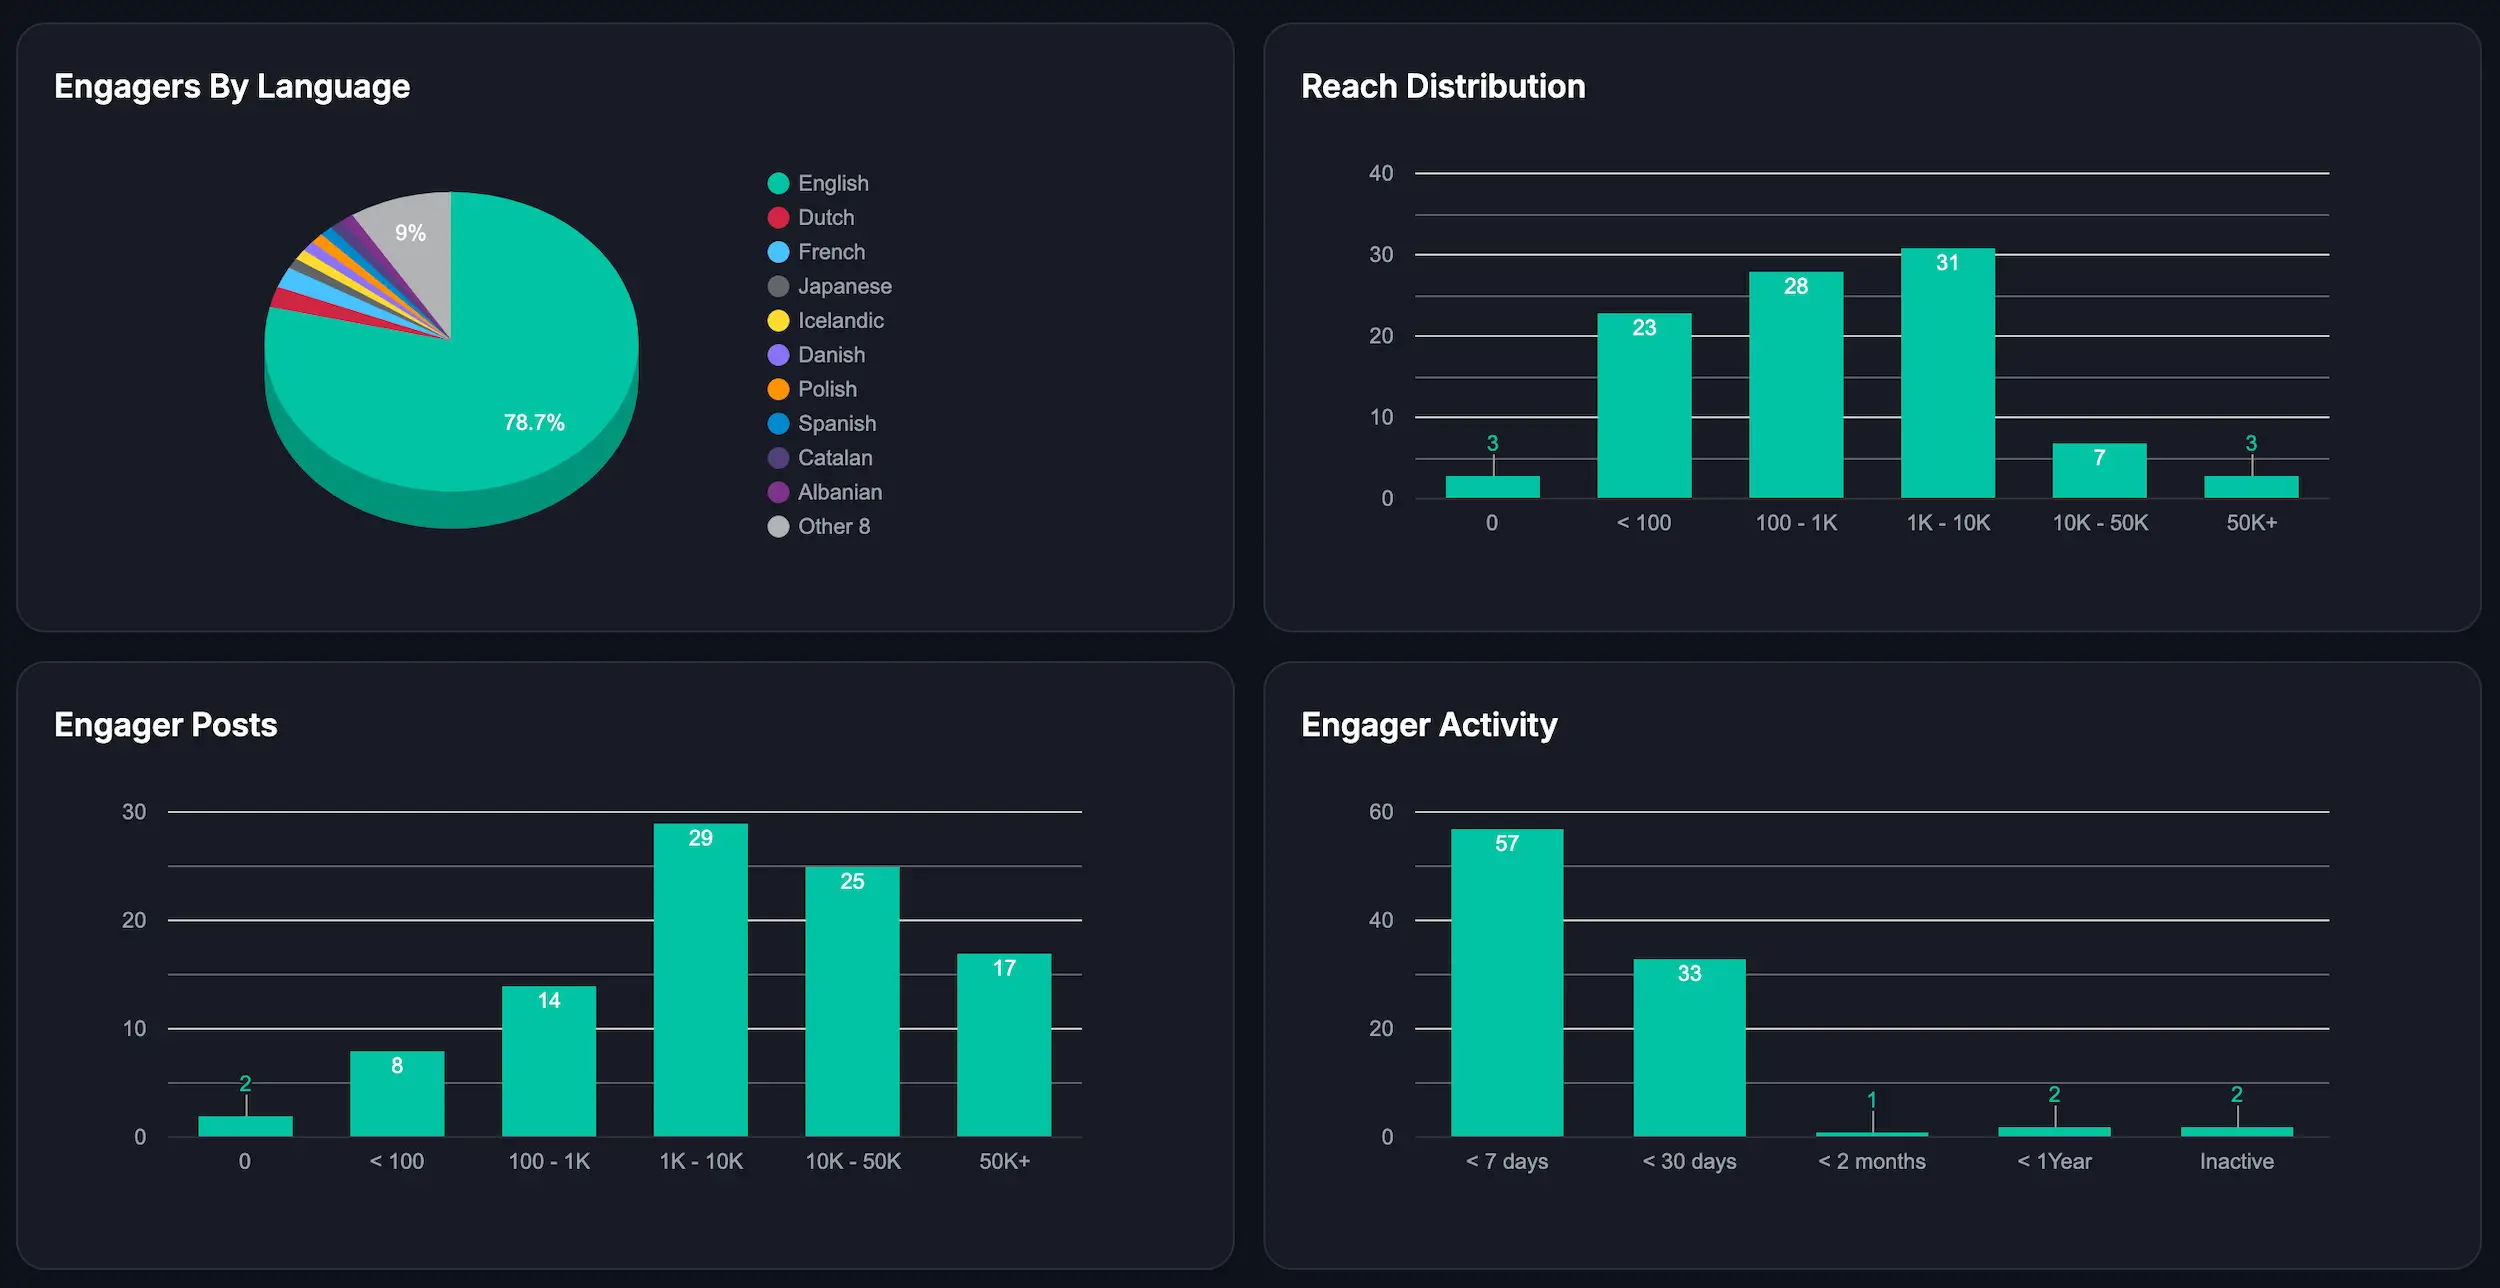
Fedica’s X analytics has user demographics and data not available on X.
Fedica brings this to the table:
- Detailed exportable reports (X only exports simple numbers)
- Keyword filters
- Content grouping by keyword (organize analytics by topics—X doesn’t do this)
- The Best Words analysis (see which words/phrases drive most engagement—X doesn’t break this down)
- Top topics analysis (see what topics your followers are talking about now—X doesn’t show this)
- Post reach tracking (track how far your posts spread—X only shows impressions)
- Post alerts (get notified when specific keywords/topics are mentioned—X doesn’t offer this)
- Timeline analysis (analyze any X account’s posting patterns—X only shows your own basic stats)
- Real-time listening (monitor keywords/hashtags as conversations happen—X doesn’t provide this)
- Analytics by location (region, state, city), gender, occupation, and more (X only shows country-level)
- Engagement by individual accounts (X only shows counts)
- Historical insights across multiple years (X data gets deleted after 1 year)
- Sentiment filtering (filter analytics by sentiment—X doesn’t offer this)
You can:
- Filter to see your best-performing posts by topic
- Analyze who engaged with your content (not just how many)
- Understand whether you’re reaching the right audience
- Schedule directly to X Communities and track performance
- Set up alerts for brand mentions or topics, then analyze engagement patterns
- See which words and phrases drive the most engagement in your posts
Why Use Fedica Over X Premium
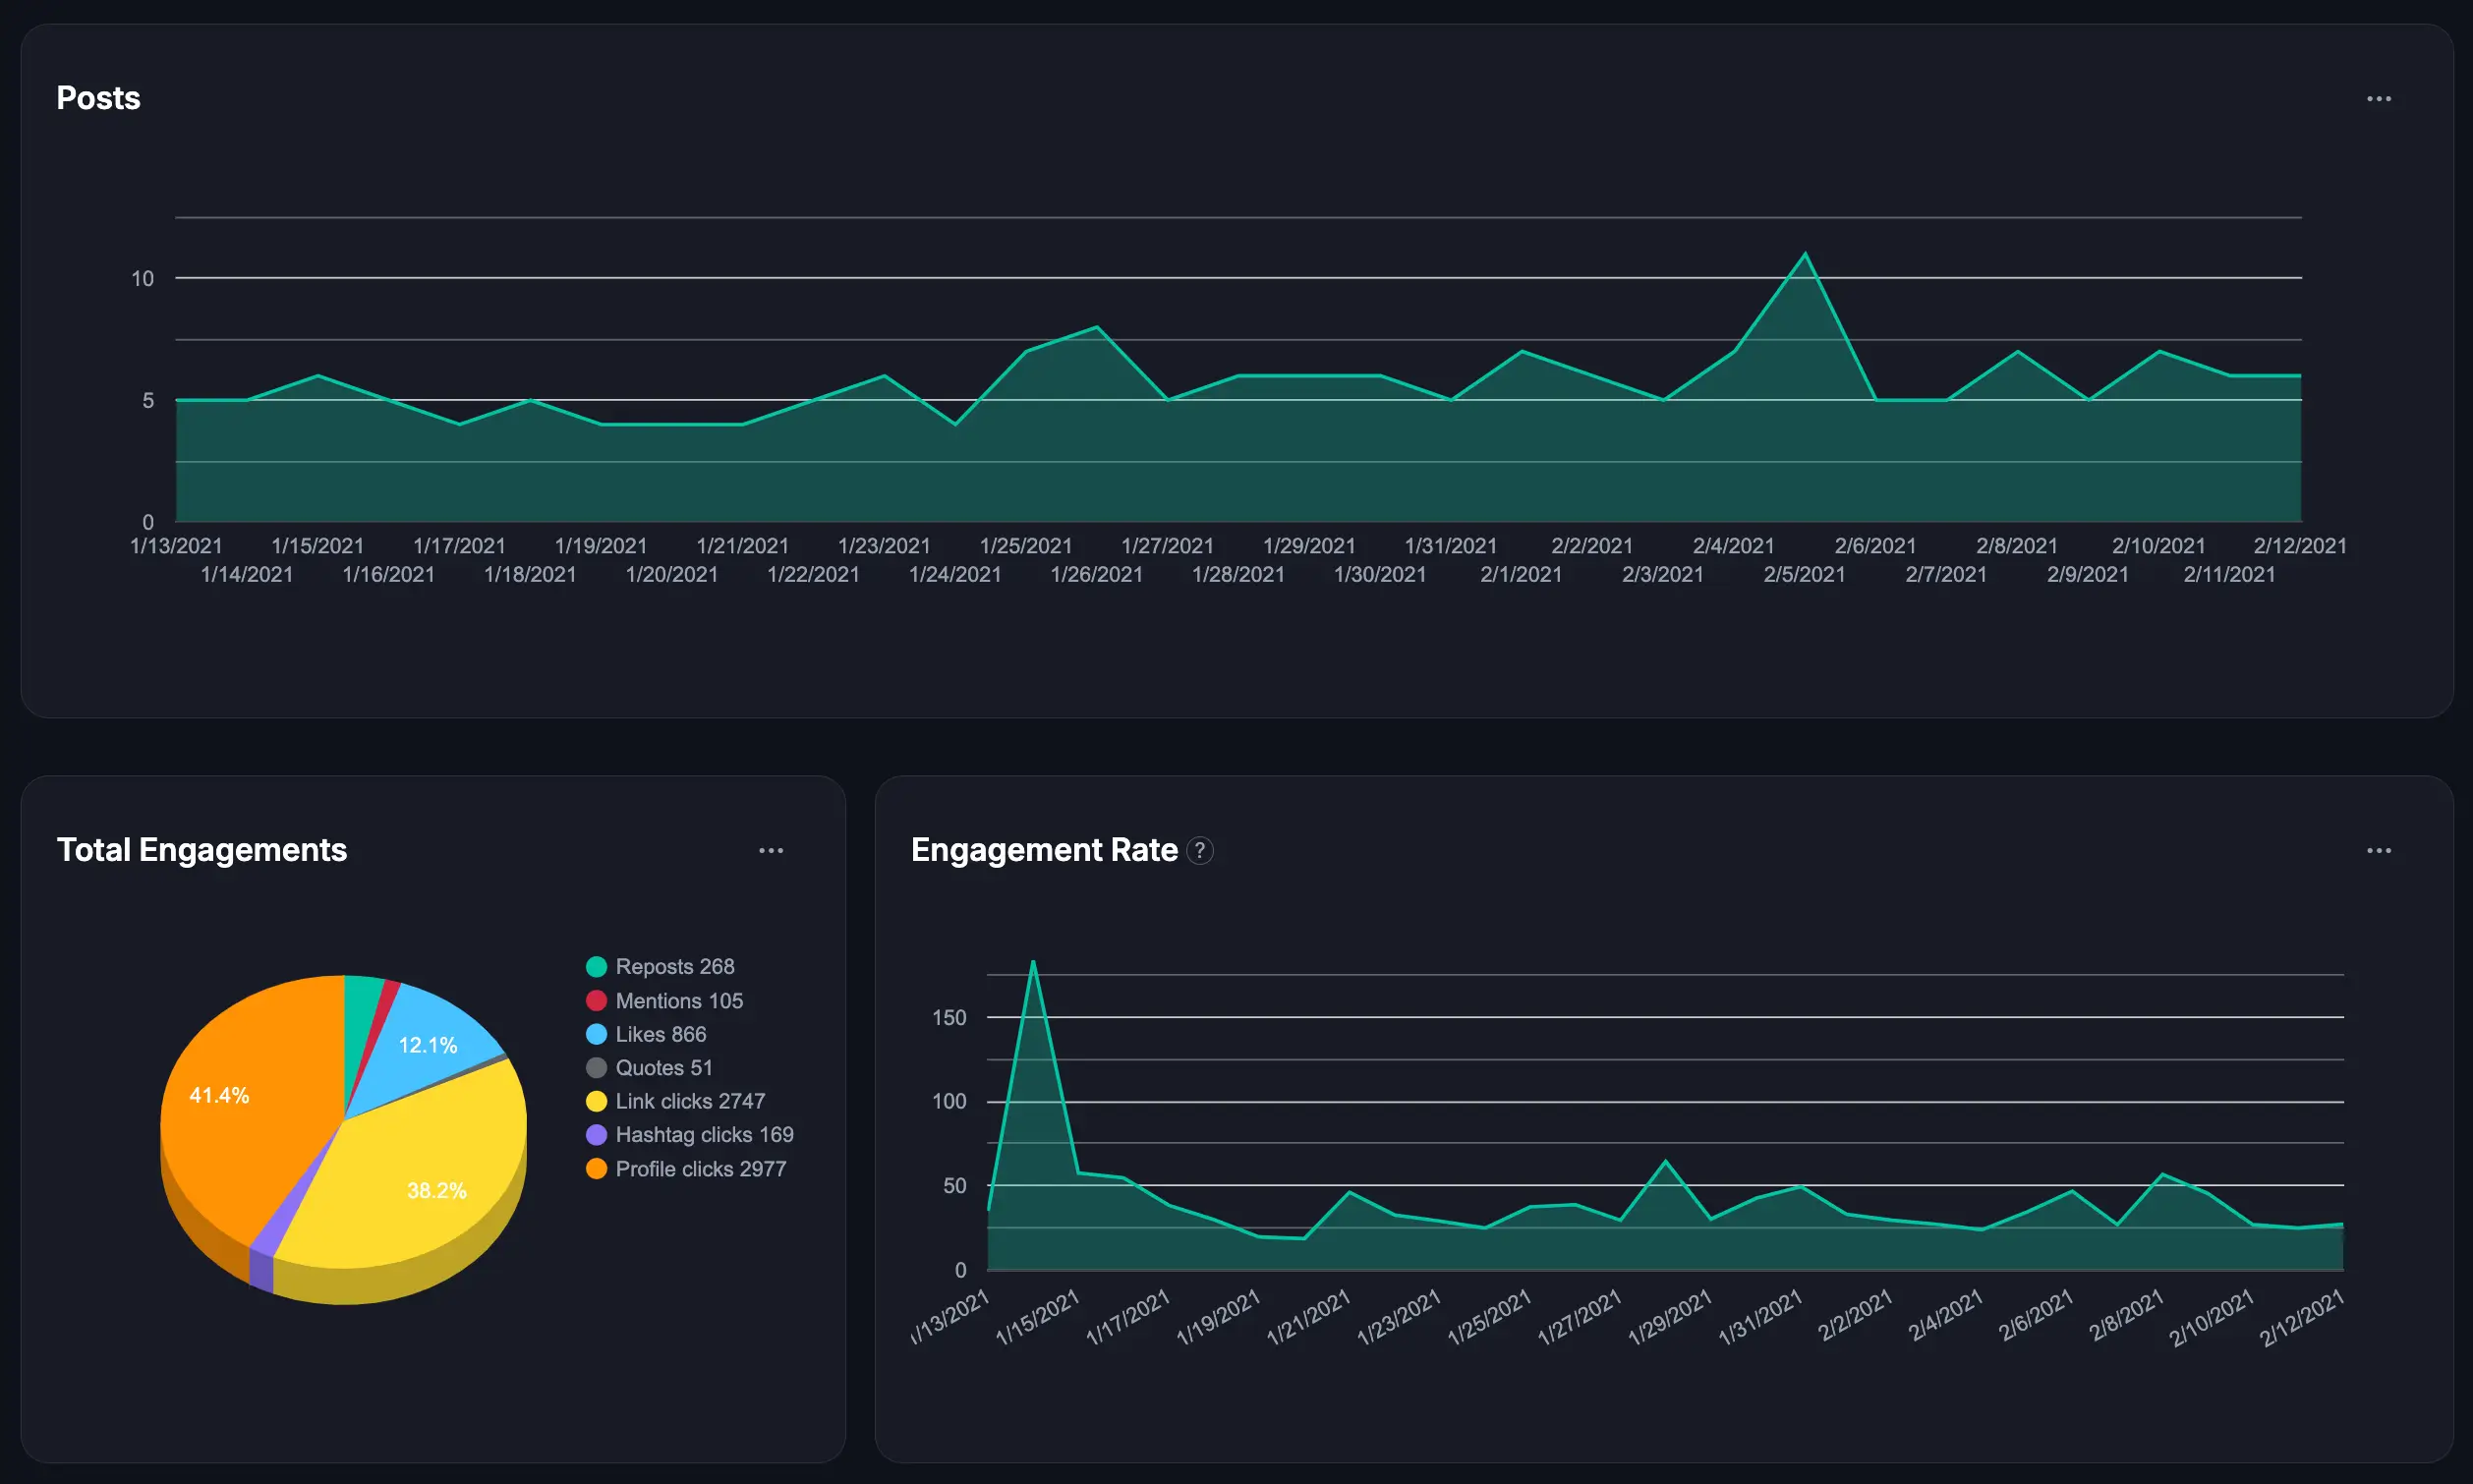
Fedica provides:
- Visual dashboards + graphs
- Deep demographic breakdowns (region, state, city, job title, profession—X only shows country, age, gender)
- Filtering by keyword and sentiment
- Bot detection, complete verified follower lists (X only shows count), see WHO unfollowed (X only shows daily numbers)
- Top interactors, top followers, and real influencer lists (X only shows counts)
- Find common followers between accounts (X doesn’t offer this)
- Top topics analysis (see what your followers are talking about—X doesn’t show this)
- Post reach tracking and post alerts (X doesn’t provide these)
- Timeline analysis and real-time listening (X only shows your own basic stats)
- The Best Words analysis (see which words drive engagement—X doesn’t break this down)
- Content grouping by keyword (organize analytics by topics—X doesn’t do this)
- The ability to analyze your own AND other accounts
- Schedule directly to X Communities
- Data retention beyond 1 year (X deletes data after 1 year)
With this level of detail, you’re not just seeing numbers you’re making smarter decisions.
Key Takeaway for X / Twitter Analytics Growth
Honestly, growing on Twitter isn’t as hard as it seems if you focus on the right stuff.
Look at impressions, engagement, and profile visits to figure out what’s working, what isnt, list those things and create new content with that in mind.
Also see what topics your audience likes the most by filtering content, and if they match the target audience you have in mind, post more about those topics.
And if you’re using Fedica, it’s even easier: you can actually see the people behind your stats and know who is engaging, not just numbers.
That makes tweaking your posts way simpler.
✅ Use X Premium to find basic analytics
✅ Use Fedica for actionable, in-depth insights
✅ Focus on these key metrics to guide your strategy:
- Impressions: Measure reach
- Engagements: Gauge interest and interaction
- Profile Visits: Assess curiosity and relevance
- Followers: Track growth and alignment with audience goals
✅ Continuously review and iterate based on your analytics
✅ Let your data guide content decisions, not guesses
Use X Premium to find basic analytics
- Use Fedica for actionable, in-depth insights
- Focus on impressions, engagements, profile visits, and followers to guide your strategy
- Continuously iterate using data
By taking the time to interpret your analytics, thinking from your readers’ shoes, taking a moment to think about their incentive to share, that’s where you see what needs improving.
This methodical approach allows you to fine-tune your content strategy, ensuring that every post is a step toward smarter, data-driven growth.